
C and C++ SoftBench User's Guide

Using SoftBench Debugger Data Graph Window
Understanding Data Graph Window Areas
Chapter 8238
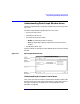
Understanding the Display Control Area
The Display Control Area includes toggle buttons and push buttons
which control the display of information on the Graph Area.
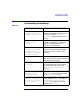
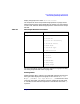
Button Displayed Information
■ Show Arc Labels When selected, the arc labels indicate
the pointer names.
■ Show Non-Followed Arcs When selected, SoftBench Debugger
displays all arcs. When deselected,
SoftBench Debugger only displays
arcs generated by Follow commands.
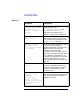
■ Suspend When selected, the Data Graph
Window does not update its display.
This reduces overhead on the
debugging session when graph
operations are not needed. When
deselected, the Data Graph Window
updates its display whenever the
user program returns control to
SoftBench Debugger.
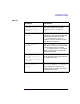
Selected -> Pops up the "Node Actions" menu
for the selected node or nodes.
SoftBench Debugger greys out the
button if you have no nodes selected.
This menu can also be popped up by
clicking the right mouse button on
the Graph Area when you have
selected one or more nodes.
Graph -> Pops up the "Graph Actions" menu.
This menu can also be popped up by
clicking the right mouse button on
the Graph Area when you have no
nodes selected.
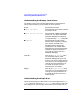
Understanding the Graph Area
The Graph Area displays nodes and arcs. You can also display the "Node
Values" dialog box using the "Node Actions" menu. Select a node, then
select Selected -> or click the right mouse button on the Graph Area, to