
C and C++ SoftBench User's Guide

Using SoftBench Debugger
Debugging Threaded Applications
Chapter 7220
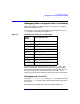
Debugging Threaded Applications
Threads are "mini-processes"—multiple "threads" of execution within a
single process. Each thread has its own execution stack, but shares
global variables with other threads in the process. There may be an
arbitrary number of threads in a process, numbered 1 through N. (DDE
assigns this thread number arbitrarily.)
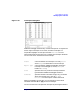
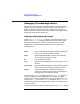
Viewing and Manipulating Threads
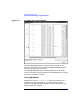
Choose "Execution: Threads…" to display a list of the threads in your
program. The "Threads" dialog box displays status information about
each thread and allows you to perform certain actions on a thread.
Highlight one or more threads and select a button to request the
following actions:
Disable Remove the selected thread(s) from the list of threads
that can run when the program resumes.
Enable Add the selected thread(s) to the list of threads that
can run when the program resumes.
Kill Kill the selected thread(s).
Stack… Display the selected thread's execution stack in a new
window.
->Next To Run Make the selected thread the current execution thread.
This thread runs first when the program resumes.
Examine Change environment to the selected thread. This
allows you to examine the status of a thread without
changing the current execution thread.
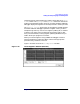
You can use the "Threads" dialog box and the "Stack View" window to
monitor the execution of threaded programs. SoftBench Debugger
indicates the currently executing thread, which is analogous to the "PC
Location," by a "->" arrow in the "Threads" dialog box. The "Stack View"
window indicates the thread being examined, which is analogous to the
"Current Location".
You can examine other threads by selecting them in the "Threads" dialog