
C and C++ SoftBench User's Guide

Using SoftBench Debugger
Debugging After a Program Fails (Core Dump)
Chapter 7 217
Debugging After a Program Fails (Core Dump)
SoftBench Debugger can diagnose some run-time errors in a program
after the program has failed.
Some signals, if not caught by the program, cause programs to write a
core file and to terminate. These signals are:
When HP-UX detects one of these errors, it writes a core file in the
directory where the process was executing (if it has write permission).
This directory does not necessarily contain the executable file; it is the
current working directory of the executing process. This core file
contains information about the state of the process when it terminated.
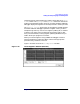
Debugging with a Core File
Choose "File: Load Corefile…" to debug a core file. Enter the core file
name (usually core) and the name of the executable file that generated
the core file.
When SoftBench Debugger first loads your program, SoftBench
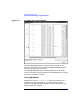
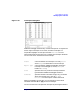
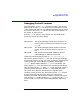
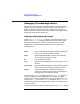
Table 7-1 SoftBench CM Command Line Man Pages
Signal
Name
Error Message Text
SIGQUIT quit
SIGILL illegal instruction
SIGTRAP trace trap
SIGIOT abort
SIGEMT emulation trap
SIGFPE floating point exception
SIGBUS bus error
SIGSEGV segmentation violation
SIGSYS bad argument to system call