
C and C++ SoftBench User's Guide

Using SoftBench Debugger
Viewing Assembly Language and CPU Registers
Chapter 7 211
Viewing Assembly Language and CPU
Registers
SoftBench Debugger is intended as a high-level (source language)
debugging aid. However, sometimes it is useful to examine your
program's behavior at the assembly language level. This can help you
determine when you have misunderstood something about the way the
compiler works.
You can examine the machine code produced by the compiler for your
program and step your program at the assembly code level. You can
examine processor and floating point registers and see how these change.
Tracing Assembly Language
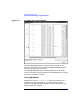
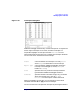
The "Show: Assembly Instructions…" menu choice brings up the
"Assembly Instructions" window. (See Figure 7-11.) This dialog box
contains a scrollable view of the assembly language code for the current
procedure of your program. The format of the code depends on your
system. The window normally shows the following:
• Source line number
• Memory address
• Disassembly listing of the actual machine code
To set a breakpoint at the assembly level:
1. Select the address (in the "Assembly Instructions" window). This
copies the address into the "()" input box.
2. Choose "Break: Set At Hex Address ( )".
You can also click the left mouse button in the Annotation Margin of the
"Assembly Instructions" window, or press the right mouse button on
the desired assembly line, to set or clear breakpoints.