
C and C++ SoftBench User's Guide

Using SoftBench Debugger
Tracing Program Flow
Chapter 7 205
Using the Trace Set/Change Dialog Box
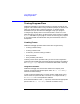
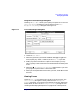
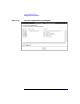
Choosing "Trace: Set…" allows you to specify all aspects of a trace. The
"Trace Set/Change" dialog box is nearly identical to the "Data
Watchpoint Set/Change" dialog box. See Figure 7-9.
Figure 7-9 "Trace Set/Change" Dialog Box
1. Choose "Trace: Set…".
2. Select the granularity (how often SoftBench Debugger triggers the
trace). Specify any "block," if desired, in the "When In" input box.
3. Modify any other information as required. For example, you may
want to specify a DDE command to be executed when the watchpoint
occurs.
4. Select the "■ Stop Execution When Hit" toggle button if you want
your program to pause when it reaches the trace.
5. When you have specified the information you want, select OK to create
the trace.
Viewing Traces
Choose "Trace: Show" to display the current list of active traces. The
"Trace Listing" dialog box is nearly identical to the "Breakpoint
Listing" dialog box. You have the same abilities to activate, deactivate,
create, delete, or edit as in the "Breakpoint Listing" dialog box. See
“Viewing and Modifying Breakpoints” on page 193 for a description of