
C and C++ SoftBench User's Guide

Using SoftBench Debugger
Tracing Program Flow
Chapter 7204
Tracing Program Flow
SoftBench Debugger's trace functions help you monitor the flow of your
program. This can be useful in many situations: perhaps you want to see
when your program calls a particular function, or executes certain
statements, but you don't want the debugger to stop your program.
Tracing simply displays the current location when a trace is hit, and
keeps executing yourprogram. Creating abasic trace issimilar to adding
a printf statement to your program. Traces can also stop your program
or can execute DDE commands when they are encountered, similar to
breakpoints.
Creating Traces
SoftBench Debugger provides several levels of trace granularity:
• At every procedure entry
• At every procedure exit
• At the entry and exit of every procedure
• Every statement
• Every assembly instruction
Creating a new trace on procedure entry or exit can take a significant
amount of timeas DDE findsall the appropriate procedures. The labelon
the "Debugger Input" input box is not sensitive while DDE is working.
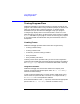
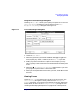
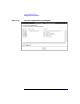
Using the Trace Menu
SoftBench Debugger has several menu selections to simplify trace
creation. Choose the appropriate option under "Trace: Trace Every"
submenu to enable tracing.
Traces can also be enabled only in certain "blocks". DDE allows you to
narrow traces to a particular file, C function, or C++ object. See "Help:
DDE Reference" for a full explanation of blocks.
Enter the desired block in the "()" input box, and choose the appropriate
option under "Trace: Trace Only" submenu to enable tracing.