
C and C++ SoftBench User's Guide

Using SoftBench Debugger
Setting and Using Breakpoints
Chapter 7190
when you are responsible for only a part of a large program, you need
only debug your particular module. Set breakpoints at the entry points of
your module, and run the program to execute the code down to your
module. When you have reached your module, you can Step through it to
see it in more detail.
1. Set a breakpoint where you want to pause the program. See “Setting
a Breakpoint” on page 190.
2. Continue your program from its current location, or choose "File:
Rerun" to restart your program. See “Loading or Rerunning an
Executable Program” on page 165.
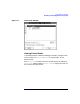
While the program being debugged runs to the next breakpoint, the
PC Location indicator displays a highlighted "Running…" and a "clock"
animation. SoftBench Debugger buffers further commands until
SoftBench Debugger becomes ready to execute them.
3. When SoftBench Debugger reaches the breakpoint, the PC Location
changes to the current program location. (Notice that the PC arrow
displays on the same line as the breakpoint annotation.) You are now
ready to continue the debugging process.
If the PC Location remains "Running…", the program being debugged
could be waiting for input. See “Interacting with Your Program” on
page 174.
To run from the current PC to the next breakpoint, select Continue. You
can use this to execute sections of the program that do not need to be
debugged.
Setting a Breakpoint
SoftBench Debugger provides many ways to set breakpoints, depending
on your needs. See “Setting Breakpoints in a Program File” on page 131
for information on setting breakpoints from within your editor.
Using the Editable Source Area
You may find this method convenient if you can see or easily retrieve the
desired source line.
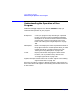
1. Locate the source statement in the Source File Area:
• If the currently viewed source file contains the statement, scroll
until you can see the line.