
C and C++ SoftBench User's Guide

Using SoftBench Debugger
Examining and Changing Data in Your Program
Chapter 7186
Calling Functions
You can call a procedure by putting the procedure call expression in the
"()" input box and selecting Print ( ).
For example, printing:
myproc(1, 2, "string")
calls the function "myproc( )". Any side-effects of the function occur
normally.
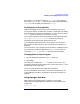
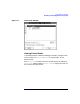
Viewing the Call Stack
When enabled, the "Stack View" window presents you with a listing of
the current execution call stack. (See Figure 7-5.) The call stack and the
source code associated with each entry may be browsed by selecting a
stack entry or using the ▲ and ▼ buttons.
To view the call stack:
1. Choose "Show: Stack…".
2. Select an entry in "Current Stack," or use the buttons on the left
side of the dialog box to move to the top of the stack, up a level, down
a level, or to the bottom of the stack. The associated source code
appears in the Editable Source Area.
3. Leave the "Stack View" window visible while selecting Step or
Continue and watch the Current Stack change.
Select "■ Show Parameters" to display the parameters passed to each
procedure on the stack.
Clear "■ Auto Update" if you do not want the stack display to update
each time the debugger gains control. This can speed up your debugging
if you Step or Continue frequently. Select Update to force an update while
you have "■ Auto Update" cleared.
By default, the stack display numbers the stack levels, with the top of
the stack being level 1. Stack numbering can be turned off, or can be
reversed so that the bottom of the stack is 1, using the "Options: Stack
Settings…" dialog box. Select the Options… button to display this dialog
box directly from the Stack View.