
C and C++ SoftBench User's Guide

Using SoftBench Debugger
Using SoftBench Debugger Window Areas
Chapter 7162
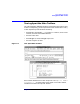
SoftBench Debugger shows the Annotation Margin, which indicates the
Program Counter location with a PC Arrow. The Annotation Margin also
shows program breakpoint locations. See “Setting and Using
Breakpoints” on page 189. Breakpoints can be set and cleared by
clicking in the Annotation Margin at the desired breakpoint location.
SoftBench Debugger displays other symbols when debugging optimized
code. See “Debugging Optimized Code” on page 227.
The user customizable buttons provide easy access to common debugger
operations, such as Step and Print( ). You can customize these buttons (and
the popup menu over the Source File Area) to provide the exact
environment desired for a particular application. See “Customizing User
Buttons” on page 228.
Below the user buttons are the DDE output area and the "Debugger
Input" input box. SoftBench Debugger uses these areas for
communicating directly with DDE, receiving output from DDE and
sending raw DDE commands to DDE.
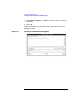
At the bottom of the screen SoftBench Debugger displays the User
Program I/O area. Programs being debugged send their output to this
area and take their input from this area. You must move the mouse
pointer into this area to enter text into the stdio of your program.