
C and C++ SoftBench User's Guide

Using SoftBench Debugger
Using SoftBench Debugger Window Areas
Chapter 7 161
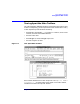
Like SoftBench Static Analyzer, SoftBench Debugger provides a "()"
input box. This input box provides input to a number of command
buttons (such as Print ( )) and many pull-down menu commands (such as
"Break: Set At Hex Address ( )" or "Visit: Procedure ()"). You
can enter information into the "()" input box for use with these
commands, either by typing or by selecting text in the source or I/O
areas. Text can be selected either by dragging the mouse, or by
double-clicking. SoftBench Debugger supports a "language sensitive"
double-click selection mode to select multiple-symbol identifiers. See
SoftBench Online Help for details about "Options: Text Selection
Behavior".
If you pause the program, the current PC (Program Counter) Location is
displayed below the "()" input box. If the program is running or if other
actions (such as loading) are in progress, the PC Location is replaced
with a highlighted status indicator and an animated "clock" icon
appears. While the user interface still responds to commands (such as
changing options settings) while the "clock" is running, the underlying
DDE debugger is busy and does not accept commands. SoftBench
Debugger queues any operations that result in sending commands to
DDE while the "clock" is running.
When the program is "Running…", you can interrupt it by selecting the
Interrupt Program button. This button changes to Interrupt Debugger when the
program is not running. The Interrupt Debugger button allows you to stop
the background debugger process. Use this button if you want to stop the
debugger, to make changes to your program and restart the debugger.
SoftBench Debugger also shows the Current Location of the source
code being displayed in the Source File Area. The Current Location is the
environment in which variables are evaluated when you use Print( ) or
similar commands. The Current Location follows the PC Location as you
execute through your program. In this case, the Current Location
indicator is "Same As PC Location". You can change the Current
Location to any function in the current call stack by using the ▲ and ▼
buttons next to the "Stack Frame" label. You can change the Current
Location to any function in your program (to print or change local static
variables, or just to view the source of a function not currently in the
stack) by entering the function name in the "()" input box and choosing
"Visit: Procedure ()". This sets the "Stack Frame" to "none".
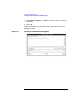
The Source File Area displays the source code for the program being
debugged. Clicking the right mouse button in this area displays a popup
menu with several useful operations. To the left of the Source File Area