
C and C++ SoftBench User's Guide


Using SoftBench Debugger
Understanding SoftBench Debugger
Chapter 7156
Understanding SoftBench Debugger
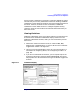
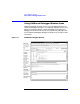
SoftBench Debugger provides interactive source and assembly-level
debugging for software programs. It provides an area for viewing source
code, an area for entering debugger commands, and areas for debugger
output and program I/O. SoftBench Debugger also provides an interface
for editing and rebuilding programs. When you work with SoftBench
Debugger, you use the same language constructs as in the program you
are debugging.
SoftBench Debugger operates in two modes. When you start it from the
SoftBench window, it operates with the knowledge of your project data.
If you start SoftBench Debugger directly from the command line, it
operates with limited knowledge of your application and you may need to
provide information such as where the source directories are located.
SoftBench Debugger lets you:
Display and modify variables
You can view the value of any type of data item in the
program and display it in the most appropriate format.
When necessary, you can change the value of a data
item.
Trace program flow
You can execute one or more statements at a time,
allowing you close examination of program flow and
data areas. If you have a large program, you might
prefer to set breakpoints at certain statements in the
program. When the breakpoints occur, you can examine
data areas and alter them if necessary. If your program
contains several procedure calls, you might want to
display the program stack to trace those calls.