
HP-UX SNAplus2 Diagnostics Guide

Using Logging and Tracing
Tracing
Chapter 390
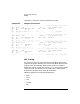
| 4849.00 CPIC Partner TP name =
| 4849.00 CPIC 40404040 40404040 40404040 40404040 @@@@@@@@@@@@@@@@
| 4849.00 CPIC 40404040 40404040 40404040 40404040 @@@@@@@@@@@@@@@@
| 4849.00 CPIC 40404040 40404040 40404040 40404040 @@@@@@@@@@@@@@@@
| 4849.00 CPIC 40404040 40404040 40404040 40404040 @@@@@@@@@@@@@@@@
Client-Server Tracing
Client-server tracing records messages that flow between SNAplus2
servers in the same domain and between the SNAplus2 server and a
client. Tracing can be activated on the data flowing between two specific
computers or between one computer and all other servers on the LAN. It
can be active on either sent or received data or on all data. The following
section explains how to perform client-server tracing using the Motif
administration program and the command-line administration program.
Performing Client-Server Tracing Using the Motif
Administration Program
To perform client-server tracing using the Motif administration program,
complete the following steps:
Step 1. Enter xsnapadmin from the command line to start the Motif
administration program and display the main window.
Step 2. Select the Diagnostics menu, then select Node tracing. The Tracing
dialog is displayed.
Step 3. Select client-server to turn on tracing of messages sent between this
server, its clients and the other servers in the domain.
Step 4. Optionally, select
Truncate messages
and enter the maximum message
size, in bytes. This can be helpful if a large amount of data is being
traced and you are interested in the protocol exchanges rather than in
the data itself. Protocol data is usually at the start of the individual
messages.
Step 5. When you are finished, click OK.
Tracing is now enabled and will be written to the following text files:
• /var/opt/sna/snacs1.trc
• /var/opt/sna/snacs2.trc