
HP-UX SNAplus2 Diagnostics Guide

Using snapfilter and snaptrcfmt
Formatting Internal Binary Trace Output into Text Files
Appendix A 113
Message flow drawing
A drawing showing the messages flowing between
different SNAplus2 components (this format does not
apply to line tracing).
Message data dump
A listing of the data in each trace message.
Message Flow Drawing
Each column in the message flow drawing corresponds to a particular
SNAplus2 component or to a group of components. The heading of each
column shows a one-character or two-character abbreviation for the
name of the component or group. Each line in the file corresponds to a
particular message flowing between SNAplus2 components.
The default options group all 3270 emulation program, RJE workstation
program, and API components into one column, and all components in
the APPN protocol code into another column. The only messages shown
are those flowing between the 3270 emulation program and the RJE
workstation program and API components and the node, and those
flowing between the node and DLC components. The drawing also
includes an individual column for each of the DLC components (see
“Message Flow Drawing Example”). If required, you can break these
groups down into individual components to show a more detailed
drawing; the additional detail is provided mainly for use by SNAplus2
support personnel.
NOTE Formatted output varies depending upon the options you select. Because
support personnel sometimes use different options, always provide them
with the original binary trace files.
Node line tracing is not shown in message flow drawings because the
data being traced is flowing between SNAplus2 and a remote component
(which is not shown in the diagram) rather than between two SNAplus2
components.
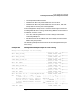
The component groups shown in “Message Flow Drawing Example”, are
as follows:
US