HP-UX SNAplus2 Diagnostics Guide Edition 3 HP 9000 Networking Manufacturing Part Number: J2740-90020 E0601 United States © Copyright 2007 © Hewlett-Packard Company, 2007. All rights reserved.
Legal Notices The information in this document is subject to change without notice. Hewlett-Packard makes no warranty of any kind with regard to this manual, including, but not limited to, the implied warranties of merchantability and fitness for a particular purpose. Hewlett-Packard shall not be held liable for errors contained herein or direct, indirect, special, incidental or consequential damages in connection with the furnishing, performance, or use of this material. Warranty.
©copyright 1980, 1984, 1986 Novell, Inc. ©copyright 1986-1992 Sun Microsystems, Inc. ©copyright 1985-86, 1988 Massachusetts Institute of Technology. ©copyright 1989-93 The Open Software Foundation, Inc. ©copyright 1986 Digital Equipment Corporation. ©copyright 1990 Motorola, Inc.
Contents 1. Overview of Problem Solving Overview. . . . . . . . . . . . . . . . . . . . . . . . . . . . . . . . . . . . . . . . . . . . . . . . . . . . . . . . . . . . . . Types of Diagnostic Information . . . . . . . . . . . . . . . . . . . . . . . . . . . . . . . . . . . . . . . . . . . Program Error Messages . . . . . . . . . . . . . . . . . . . . . . . . . . . . . . . . . . . . . . . . . . . . . . . Log Messages . . . . . . . . . . . . . . . . . . . . . . . . . . . . . . . . . . . . . . . . . . . . . .
Contents Controlling Logging Using Command-Line Administration Program . . . . . . . . . . . . . Changing the Names and Locations of Log Files . . . . . . . . . . . . . . . . . . . . . . . . . . . . Enabling Central Logging and Local Logging. . . . . . . . . . . . . . . . . . . . . . . . . . . . . . . Determining Which Messages Are Logged . . . . . . . . . . . . . . . . . . . . . . . . . . . . . . . . . Controlling Log File Size . . . . . . . . . . . . . . . . . . . . . . . . . . . . . . . . . . . . . . . .
Preface The HP-UX SNAplus2 Diagnostics Guide describes and offers solutions to the most common problems you might encounter while using SNAplus2. This book also introduces the diagnostic tools available to you, and explains how to collect diagnostic data for support personnel.
Prerequisite Knowledge Before reading this book, you should have a knowledge of SNA and APPN concepts. For a list of books that provide this information, see “Related Publications”.
About This Book This section explains how information is organized and presented in this book. Token Ring and FDDI adapters are not supported on HP-UX 11i v3. Organization of This Book This book is organized as follows: Chapter 1, “Overview of Problem Solving.” Describes the diagnostic tools that are available to you, why they are important, and when to use them. Chapter 2, “Resolving Common Problems.
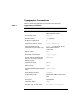
Typographic Conventions Table 1, shows the typographic styles used in this document. Table 1 Typography Conventions Special Element Sample of Typography Document title HP-UX SNAplus2 Administration Guide File or path name sna.
Table 1 Typography Conventions Special Element Sample of Typography Motif button Status Motif menu Services Motif menu item Configure node parameters Keyboard keys Enter Hexadecimal value 0x0a 11
SNAplus2 Publications SNAplus2 publications include user guides, administrator guides, and programmer guides. The following sections describe the contents of each book. Publications for Users SNAplus2 provides the following user guides: HP-UX SNAplus2 General Information Provides an introduction to SNAplus2 and explains key product concepts and features.
Explains how to install the SNAplus2 software and set up system files. HP-UX SNAplus2 Upgrade Guide Provides information about upgrading to the current version of SNAplus2 from previous versions. It includes information about converting configuration files, rebuilding applications that use the SNAplus2 application program interfaces (APIs), and changes in other SNAplus2 functions. HP-UX SNAplus2 Administration Guide Explains how to enable, configure, and manage SNAplus2.
Communications (CPI-C). HP-UX SNAplus2 3270 & TN3270 HLLAPI Programmers Guide Contains the information you need to write application programs using High-Level Language Application Program Interface (HLLAPI). HP-UX SNAplus2 LUA Programmers Guide Contains the information you need to write applications using the Conventional LU Application Programming Interface (LUA).
Related Publications For information about SNA, APPN, or LU 6.2 architecture, refer to the following IBM documents: • IBM Systems Network Architecture: — LU 6.
1 Overview of Problem Solving Chapter 1 17
Overview of Problem Solving Overview Overview SNAplus2 is a complex software product. You may therefore occasionally encounter problems when you are running SNAplus2, either with SNAplus2 itself, or with other system components. This manual describes some of the more common types of problems that you might encounter, provides guidance for investigating them, and describes how to gather further diagnostic information.
Overview of Problem Solving Types of Diagnostic Information Types of Diagnostic Information This section describes the range of diagnostic information that is available to you to resolve SNAplus2 system problems, and how to use each type. SNAplus2 diagnostic information can be categorized in the following way: • “Notification” information is always available to you; it cannot be turned on or off. This type of information indicates that an error has occurred and should be investigated.
Overview of Problem Solving Types of Diagnostic Information These messages are displayed by the system whenever a serious system problem is encountered. Information from the Log File The log file contains information about program events. There are three different types of events about which information is logged: problem, exception, and audit. Each is captured to a log file that you can access to obtain the information needed to resolve a problem.
Overview of Problem Solving Types of Diagnostic Information • the command-line administration program • the 3270 emulation program • RJE SNAplus2 also includes manual (“man”) pages. You will find the online help information useful both in preventing and resolving problems. The rest of this chapter describes each kind of diagnostic information in more detail, and explains where to find SNAplus2 online help information.
Overview of Problem Solving Types of Diagnostic Information Often a program error message is accompanied by log messages that provide additional information (For information about this error log file, see “Types of Log Information”). Log Messages When a program is executing, different events such as starting or ending a session occur. SNAplus2 records log messages for these and other events in log files to provide you with specific information about the internal activities of SNAplus2.
Overview of Problem Solving Types of Diagnostic Information message from the remote system. By default, SNAplus2 logs exception events. To control logging exception events using the Motif administration program, see “Controlling Logging Using the Motif Administration Program”.
Overview of Problem Solving Types of Diagnostic Information of a later problem message. Common recommended actions include the following: • Check the local SNAplus2 configuration and add, modify, or activate resources. For more information, refer to the HP-UX SNAplus2 Administration Command Reference. • Check the HP-UX computer's resources (such as memory, hard disk space, or adapter cards). For more information, refer to your HP-UX operating system documentation.
Overview of Problem Solving Types of Diagnostic Information The following section briefly describes the types of tracing and provides examples of when to use tracing. For detailed information about tracing, see “Tracing”. Types of Tracing SNAplus2 provides the following types of tracing: Line tracing Use line tracing to trace messages between the node and the remote system. You can control the amount of tracing by specifying the resource type (DLC, port, link station, or session).
Overview of Problem Solving Types of Diagnostic Information Use client-server tracing to trace messages flowing between the SNAplus2 server and a client, as well as between SNAplus2 servers in the same domain. Client-server tracing can be used, for example, to find out why a client is unable to connect to the server. Client-server tracing is written to text files. For more information, see “Client-Server Tracing”.
Overview of Problem Solving Types of Diagnostic Information select specific entries from an internal trace file by using the snapfilter utility, and you can format binary trace output into text files by using the snaptrcfmt utility. For more information about these utilities, see Appendix A, “Using snapfilter and snaptrcfmt.” Using Tracing If you encounter a problem, use the SNAplus2 trace facilities to obtain more information about the messages that are flowing across specific interfaces.
Overview of Problem Solving Types of Diagnostic Information Help Information In addition to log and trace information, which describe SNAplus2 system activities that occur during a problem, SNAplus2 also includes standard online help information. You may find this information useful if you encounter problems while using a particular program or if you want more information about a certain topic or about using a command.
Overview of Problem Solving Types of Diagnostic Information snapadmin -h 3270 Emulation Program Online Help SNAplus2 3270 emulation program online help provides help for the following program elements: The main screen This help describes the overall function of the program. Each menu This help describes the overall function of the menu. Each menu option This help provides detailed information about the functions provided by the menu options.
Overview of Problem Solving Types of Diagnostic Information them if you need a quick overview of a topic or information about how to use a particular command. To get a man page from the command line, type man , where represents the name of the page you want to see. For example, to see the “snap” man page, type man snap. In addition to displaying the requested information, man pages provide a list of related commands.
2 Resolving Common Problems Chapter 2 31
Resolving Common Problems Overview Overview This chapter identifies some of the more common problems that users may experience when running SNAplus2. The steps suggested here should help you to resolve most of these problems.
Resolving Common Problems Basic Checks Basic Checks You should perform the following basic checks, whenever you experience a problem. Perform each of the checks described in this section before moving on to “Resolving Specific Problems”. What to Check First Before suspecting a problem with SNA or SNAplus2, take a few moments to complete the following checks: Step 1. Ensure that all communications cables are attached properly to your machine, switches, and hubs. Step 2.
Resolving Common Problems Basic Checks The SNA daemons may fail to start if there is an error in the configuration, such as a reference to a missing configuration record. Other errors can occur if SNAplus2 has not been installed correctly. For example: • There may be no domain configuration file (sna_domn.
Resolving Common Problems Basic Checks SNAplus2 Administration Guide Refer to HP-UX SNAplus2 Administration Guide for information about configuring resources. Check Communication with Other SNA Nodes To check communication with other SNA nodes, check the following: Step 1. Check that links to other SNA nodes have been established. • If you are using the Motif administration program: Step 1. Check that the port that you are trying to use is marked as active. Step 2.
Resolving Common Problems Basic Checks under “DLCs”, each of which represents a physical communications adapter that supports one or more ports. The Motif administration program automatically defines and starts the DLC components when ports are defined and started. When using the command-line administration program, however, you must explicitly define and start the DLCs to which the ports belong. Step 3. If links to other SNA nodes have been established, then start the DLC/port or link station.
Resolving Common Problems Basic Checks Check the port configuration in one of the following ways: • If you are using the Motif administration program, then zoom on the DLC/port. • If you are using the command-line administration program then issue the snapadmin query_port command to view the port configuration. Step 4. If you have remote equipment, check that the appropriate cables are plugged in and that the equipment being connected is active. Step 5.
Resolving Common Problems Basic Checks primary and secondary to secondary. Step 3. If your link station still fails to start then check the sections below for your particular link type. SDLC Link Station Fails to Start If your SDLC link station fails to start, perform the checks listed in “Link Station Fails to Start” before performing the checks listed below. Check your modem configuration: Step 1. Check that SNAplus2 is raising the data terminal ready (DTR) signal.
Resolving Common Problems Basic Checks circuit, then it is likely that the call request packet (sent out to establish a link station) carries incorrect parameters. You should therefore carry out the following checks: Check following configuration parameters: Step 1. If you are setting up SNAplus2 to receive incoming calls then it is vital that the X.25 software is set up to route these calls to SNAplus2.
Resolving Common Problems Basic Checks Step 1. Check that the local SAP (configured in the link station's port lsap_address parameter) matches the remote system's remote SAP. Step 2. Check that the remote SAP (configured in the link station's lsap_address parameter) matches the remote system's local SAP. Step 3. If the link station is an Ethernet link station then ensure that the LAN type matches that used by the remote system.
Resolving Common Problems Basic Checks client is able to use by issuing the snapadmin add_backup command. Refer to the HP-UX SNAplus2 Administration Command Reference for more information about this command. No Active Nodes Displayed If the snapadmin query_node_all does not report any nodes, check the following: Step 1.
Resolving Common Problems Basic Checks Step 2. Check whether the Windows client is connected to the TCP/IP network and can see a server (use the ping command). Step 3. Ensure that the Windows client has been installed and configured correctly (refer to the HP-UX SNAplus2 Installation Guide for information about installing Windows clients and refer to the HP-UX SNAplus2 Administration Guide for information about configuring Windows clients). Step 4.
Resolving Common Problems Basic Checks • The SNAplus2 Motif administration program. • The SNAplus2 command-line administration program. • Client/server configuration is held in the sna.ini file on the server, this can be viewed and modified using the Motif administration program or the command-line administration program. • HP-UX client configuration information is held in the sna_clnt.net file. • Windows 16 client configuration is held in the sna.ini file.
Resolving Common Problems Basic Checks RJE Workstation Style Files The RJE workstation style files contain parameters that determine the behavior of your RJE workstation. You may want to check the style file to see how certain options have been set. The style files also contain information about how the RJE workstation communicates with the host and its output devices.
Resolving Common Problems Resolving Specific Problems Resolving Specific Problems If the problem persists after you have completed all the basic checks listed in “Basic Checks” then this section provides further guidance on specific problems. Continue your investigation by working through the sections that are most relevant to your problem.
Resolving Common Problems Resolving Specific Problems xhost + Resolving Problems with the 3270 Emulation Program This section describes what to do if you encounter problems with the 3270 emulation program. SNAplus2 3270 Emulation Program Fails to Start If the SNAplus2 3270 emulation program fails to start then you should check the following: Step 1. If you are using the character-based 3270 emulation program, ensure that the TERM environment variable matches your terminal type.
Resolving Common Problems Resolving Specific Problems the session is started. This option is usually used when running HLLAPI applications that control the display using the DISPLAY_ON and DISPLAY_OFF verbs. Change this option by modifying the Host Screens Suppressed at Startup option in the Customize Display Parameters dialog.
Resolving Common Problems Resolving Specific Problems 3270 emulation program Control menu. If the status of the LU is shown as “enabled” then check that the link station over which the 3270 emulation program is communicating to the host is active. See “Check Communication with Other SNA Nodes” for information about this. Step 5.
Resolving Common Problems Resolving Specific Problems Step 2. Check that the session is logged on and not running another application. (You can usually only transfer files at the “Ready” prompt.) Step 3. If command line or HLLAPI file transfer fails: Step 1. Check the session ID configured in the style file matches that used on the command line. Step 2. Check that there is an active 3270 emulation program running with the same HP-UX user ID. Step 3. Try the menu-operated file transfer. Step 4.
Resolving Common Problems Resolving Specific Problems When you have started the emulation program in the foreground then check the following: Step 1. Check the status of the 3270 printer session using the Printer Session menuitem of the Control menu. Step 2. If a 3270 printer session is displayed, but is marked as enabled, then check that the link station has been started (see “Check Communication with Other SNA Nodes”) and that the LU has been activated at the host.
Resolving Common Problems Resolving Specific Problems Use the snaprjecon program to issue a command to the host to verify that the host subsystem (usually JES) is active. Refer to your IBM documentation for information about host commands. Refer to HP-UX SNAplus2 RJE Users Guide for a list of relevant IBM manuals. For example, in JES2, a $S command may be required to activate the printer or punch.
Resolving Common Problems Resolving Specific Problems Step 2. Check that the directories you specified exist. Resolving APPC or CPI-C Application Problems If you are having problems with an APPC or CPI-C applications, do the following: Step 1. Check that the application is correctly installed Step 2. Check that the mode, LUs and link required are correctly configured Step 3. If a problem occurs when the application originates the conversation do the following: Step 1.
Resolving Common Problems Resolving Specific Problems define_cpic_side_info command or APPCLLU environment variable) and TP name (APPCTPN), or use the default LU pool and TP name. Step 9. If the application ran on a previous version of the SNA software, refer to the HP-UX SNAplus2 Upgrade Guide. Resolving LUA Problems For LUA, do the following to determine why the application is not working: Step 1. Check that the application is correctly installed and that you have permission to run it. Step 2.
Resolving Common Problems Resolving Specific Problems “extra news” messages which the HLLAPI application may not be able to handle. Step 4. Check that the application is waiting correctly for prompting text. If a HLLAPI file transfer fails, refer to “Unable to Transfer files Using 3270 File Transfer”. Resolving MS Application Problems To determine why a Management Services (MS) application is not working, issue the snapadmin query_nmvt_application command.
Resolving Common Problems Resolving Specific Problems • If you are using the command-line administration program, issue the snapadmin status_connectivity command. Step 2. Check that the LUs are attached in the configuration and that they are not being used by other applications. • If you are using Motif administration program, zoom on the link stations and LU pool. • If you are using the command-line administration program, issue the snapadmin query_downstream_lu command. Step 3.
Resolving Common Problems Resolving Server Administration Problems Resolving Server Administration Problems To determine why servers cannot administer one another, do the following: Step 1. Issue the snapadmin query_sna_net command on each server to obtain information about the configuration of the topology. Step 2. Check that the servers are in the same domain. Step 3. Check the TCP/IP connections using the HP-UX ping command.
Resolving Common Problems Reporting Problems to Support Personnel Reporting Problems to Support Personnel There are some system problems that you will not be able to resolve. In these cases, the Message action field may recommend that you contact your support personnel.
Resolving Common Problems Reporting Problems to Support Personnel changes have occurred since it stopped working? • The numbers of any logs that are related to the problem. In addition to the information provided in the readme file, see “Other Information to Provide to Support Personnel”. Other Information to Provide to Support Personnel In addition to the readme file, gather the following information so that you can make it available to support personnel.
Resolving Common Problems Reporting Problems to Support Personnel In addition to the configuration files, support may ask for the style files for the following programs: • The 3270 emulation program Refer to the HP-UX SNAplus2 3270/3179G Users Guide for more information about determining which style file you are using. • The RJE workstation program Refer to the HP-UX SNAplus2 RJE Users Guide for more information about determining which style file you are using.
Resolving Common Problems Reporting Problems to Support Personnel • Kernel drivers, type the following on the command line: snapwhat /stand/vmunix System Resources In addition to checking which programs are running, you can check the HP-UX processing environment. Your support team may ask you to run the ipcs standard HP-UX utility and ps standard HP-UX utility to obtain information about the status of HP-UX processes and resources.
Resolving Common Problems Reporting Problems to Support Personnel documentation.
Resolving Common Problems Reporting Problems to Support Personnel 62 Chapter 2
3 Using Logging and Tracing Chapter 3 63
Using Logging and Tracing Overview Overview Logging and tracing are valuable diagnostic tools that provide you and your support team with useful information for solving SNAplus2 problems. This chapter describes how to perform logging and tracing using either the Motif administration program or the command-line administration program (refer to the HP-UX SNAplus2 Administration Command Reference for complete descriptions of the commands.) Samples of logging messages and tracing output are also provided.
Using Logging and Tracing Controlling Logging Using the Motif Administration Program Controlling Logging Using the Motif Administration Program The easiest way to control logging of events for SNAplus2 is to use the Motif administration program (xsnapadmin). This program provides a graphical user interface from which you can perform diagnostic tasks, such as selecting the type of logging for your system, as well as the message types to log.
Using Logging and Tracing Controlling Logging Using the Motif Administration Program (unless they have local overrides configured using the command-line administration program). Log audit messages Select this option to instruct the system to log all audit events. If you make this selection, you will be prompted to select verbose or succinct logging. When you have done this, click OK.
Using Logging and Tracing Controlling Logging Using Command-Line Administration Program Controlling Logging Using Command-Line Administration Program You can use the command-line administration program to perform the following tasks. • Change the names and locations of the log files and backup log files. • Enable central or local logging. • Enable or disable logging of audit and exception events on individual servers. • Change the maximum log file size. • Enable verbose or succinct logging.
Using Logging and Tracing Controlling Logging Using Command-Line Administration Program sna.log, specify the following commands: snapadmin set_log_file, log_file_type = ERROR, file_name = sna.log snapadmin set_log_file, log_file_type = AUDIT, file_name = sna.log Audit and error log files are ASCII text files. Use a standard HP-UX text editor such as vi to view them.
Using Logging and Tracing Controlling Logging Using Command-Line Administration Program categories of messages are recorded on servers that use the global settings. • Use snapadmin query_log_type to check which categories of messages are being recorded on a particular server. For more information about these administration commands, refer to the HP-UX SNAplus2 Administration Guide. Controlling Log File Size SNAplus2 enables you to prevent log files from becoming too large and consuming disk resources.
Using Logging and Tracing Controlling Logging Using Command-Line Administration Program Choosing the Format of Logs You control the amount of detail recorded in logs by choosing one of the following logging formats: Verbose logging Each message contains the message number, originating component, type of message, text of the message, the cause of the condition leading to the message, and any recommended action.
Using Logging and Tracing Controlling Logging Using Command-Line Administration Program ----------------------- 13:55:16 EDT 15 May 1997 ----------------------CFG_DAEM Message 4097 - 132, Subcode: 1 - 1 Log category: PROBLEM Cause Type: External System: sna18 Process ID: 17908 (snapcfgdae) The initially active port could not be started when starting the node. Port name = SDLCP0 Cause: The config configuration.
Using Logging and Tracing Controlling Logging Using Command-Line Administration Program Subcode A unique identifier that indicates the point within SNAplus2 at which the message was logged. This subcode is used only by SNAplus2 support personnel. Log category The event category of the log message. Possible values are Problem, Exception, or Audit. Cause type The cause of the message. Possible values are: Internal Internal error in a SNAplus2 component.
Using Logging and Tracing Controlling Logging Using Command-Line Administration Program system. Audit A normal event, reported for information only. System name The name of the computer where the condition that caused the message was detected. Process ID and name The HP-UX process ID (from the computer whose system name is shown) and the executable name of the process that logged the message. The process ID is shown only for the 3270 emulation program, RJE workstation program, and API components.
Using Logging and Tracing Controlling Logging Using Command-Line Administration Program This field is generally not used when the cause type is Internal. Message action Recommended action as a result of the message. For audit messages, which provide accounting and progress information instead of reporting error conditions, this field is not included because no action is required.
Using Logging and Tracing Controlling Logging Using Command-Line Administration Program • A (audit) System name The name of the computer where the condition that caused the message was detected. Process ID and name The HP-UX process ID (preceded by the characters PID) and executable name of the process that logged the message. The process ID is shown only for the 3270 emulation program, RJE workstation program, and API components.
Using Logging and Tracing Controlling Logging Using Command-Line Administration Program The message_number is returned by SNAplus2 in the header information for the message and consists of two numbers separated by a hyphen (-). The utility returns the name of the component that logged the message and the information from the Message number, Cause type, Message cause, and Message action fields as shown for verbose logging.
Using Logging and Tracing Tracing Tracing This section explains how to use SNAplus2 trace facilities to collect diagnostic data while the SNAplus2 system is running and how to produce trace output. NOTE Turn tracing on only when you are requested to do so by support personnel or when you need the trace output to diagnose a problem. At other times, turn off all tracing because it degrades system performance.
Using Logging and Tracing Tracing Figure 3-1 Tracing Interfaces The trace facilities write data to text files and to binary files. Use any standard ASCII text editor to view the text files. Use the snaptrcfmt command-line utility to convert the binary output to text files so that you can also view them with an ASCII text editor. For more information, see “Formatting Internal Binary Trace Output into Text Files”.
Using Logging and Tracing Tracing Performing Line Tracing To perform line tracing using the Motif administration program, complete the following steps: Step 1. Enter xsnapadmin from the command line to start the Motif administration program and display the main window. Step 2. Select the Diagnostics menu, then select Node tracing. The Tracing dialog is displayed. Step 3. Select one of the following DLCs to perform line tracing for: • Token Ring • Ethernet • SDLC • FDDI • X25 Step 4.
Using Logging and Tracing Tracing files: • Add the dual_files parameter to specify whether tracing is to one or two files: — To trace to two files, specify snapadmin set_trace_file, dual_files = YES — To trace to one file, specify snapadmin set_trace_file, dual_files = NO • Add the trace_file_size parameter to specify the maximum size of the trace file, in bytes. (If dual_files is set to NO, this parameter is ignored.
Using Logging and Tracing Tracing the trace files have been renamed): • /var/opt/sna/sna1.trc • /var/opt/sna/sna2.trc If you are tracing an SDLC line and would like more detailed trace information, you can get this by using internal tracing on SDLC as well as line tracing. The additional detail is formatted as part of the output for line tracing, so that you will see all of the SDLC tracing in one file. For more information, see “Internal Tracing.
Using Logging and Tracing Tracing “Sample Line Trace File”, shows a sample line trace file. Example 3-4 Sample Line Trace File -------------------------------------------------17:21:04.040 PDT 22 Oct 1997 SND>> ACTPU +RSP LFSID:00000 SDLC0.SDLCP1.SDLCL1 TH: 2D000000BC9B BBIU EBIU EFI OAF:00 DAF:00 SNF:BC9B RH: EB8000 SC FI RU: 11124040 40404040 40400000 07010000 .. ...... ..@@@@@@@@...... 00000000 .... .... -------------------------------------------------17:21:04.
Using Logging and Tracing Tracing • CSV • NOF Performing API Tracing To set up and control API tracing, complete the following steps before starting the application program using the API: Step 1. Use the SNATRC environment variable to specify one or two trace data files and whether to activate tracing when the application starts. The syntax for the SNATRC environment variable is: file1 [:[file2][:]] Specify the following parameters: file1 Name of the trace file.
Using Logging and Tracing Tracing Specify a path for the text file to which trace data will be written. Do not specify the name of a device (such as /dev/tty) or a print spooler as a trace file name. If you do not specify a full path for the trace file or files, SNAplus2 uses the directory from which you start the application. Controlling API Tracing from within an Application SNAplus2 provides the ability to control API tracing from within an application program.
Using Logging and Tracing Tracing Controlling Tracing on Automatically Started Invokable TPs You can trace an automatically started invokable transaction program (TP) by configuring the appropriate environment variables when you run the snaptpinstall program. Refer to the HP-UX SNAplus2 Administration Guide for more information.
Using Logging and Tracing Tracing application first writes to it. Normally, the file is reset and its contents discarded when an application writes its first trace message to the file. If you are tracing two or more applications to the same file, or if you want to trace two or more runs of the same application to the same file, you can prevent the file from being reset by setting the SNATRCRESET environment variable to NO.
Using Logging and Tracing Tracing APPC, NOF, MS The verb control block supplied by the application to the corresponding API library is traced when the verb is issued and when it returns. For verbs issued through the asynchronous entry point and for the APPC [MC_]RECEIVE_AND_POST verb issued using the synchronous entry point, both the initial return (indicating that the verb was issued successfully and is in progress) and the return to the callback routine (when the verb completes) are traced.
Using Logging and Tracing Tracing returns. If the verb returns IN_PROGRESS to indicate asynchronous completion, it is traced when it completes. The top of each section of tracing shows the name of the LUA verb issued and the result on its return (taken from the primary and secondary return codes). Any data being sent or returned is also traced following the verb control block, with the address at which the data is stored (taken from the verb control block).
Using Logging and Tracing Tracing Shown following func_number. data_string This parameter is traced only if it is actually used by this function. For more information, refer to the HP-UX SNAplus23270 & TN3270 HLLAPI Programmers Guide.
Using Logging and Tracing Tracing | | | | | 4849.00 4849.00 4849.00 4849.00 4849.00 CPIC CPIC CPIC CPIC CPIC Partner TP name = 40404040 40404040 40404040 40404040 40404040 40404040 40404040 40404040 40404040 40404040 40404040 40404040 40404040 40404040 40404040 40404040 @@@@@@@@@@@@@@@@ @@@@@@@@@@@@@@@@ @@@@@@@@@@@@@@@@ @@@@@@@@@@@@@@@@ Client-Server Tracing Client-server tracing records messages that flow between SNAplus2 servers in the same domain and between the SNAplus2 server and a client.
Using Logging and Tracing Tracing Performing Client-Server Tracing Using the Command-Line Administration Program To set up and control client-server tracing using the command-line administration program, complete the following steps: Step 1. Specify the snapadmin set_cs_trace command: Step 2. Add the dest_sys parameter to the snapadmin command to specify the client or server name for which tracing is required (this is an ASCII string).
Using Logging and Tracing Tracing Tracing is now enabled and will be written to the following text files: • /var/opt/sna/snacs1.trc • /var/opt/sna/snacs2.trc For more information about controlling client-server tracingon HP-UX computers, refer to the descriptions of the snapadmin set_cs_trace and snapadmin query_cs_trace commands in the HP-UX SNAplus2 Administration Command Reference.
Using Logging and Tracing Tracing Message data is shown in three columns: hexadecimal, interpreted as EBCDIC, and interpreted as ASCII. Therefore, a text string in the message data appears as readable characters either in the EBCDIC or in the ASCII column according to its character set. TN Server Tracing TN server tracing records messages flowing between the SNAplus2 TN server and its TN3270 client across the LAN.
Using Logging and Tracing Tracing NOTEYou would not usually need to specify FMAPI for first-level diagnostics. CFG Configuration message tracing: messages relating to the configuration of TN server Step 4. When you are finished adding parameters and values to the command, press Enter. Tracing is now enabled and will be written to the following text files: • /var/opt/sna/snatnsv1.trc • /var/opt/sna/snatnsv2.
Using Logging and Tracing Tracing tracing, complete the following steps: Step 1. Use the SNAMSG environment variable to specify one or two trace data files. The syntax for the SNAMSG environment variable is: file1[:file2] Specify the following parameters: file1 Name of the trace file file2 Optionally included name of a second trace file. Use a colon to separate the two file names. For example: • Type the following from the command line to trace to two files: export SNAMSG=file1.trc:file2.
Using Logging and Tracing Tracing trace file. Each individual message is preceded by a horizontal line indicating the time the trace entry was made. • The process ID of the process being traced appears at the start of each line. The process ID is followed by an indicator of the interface being traced (for example, FMI).
Using Logging and Tracing Tracing Controlling Internal Trace Files You can enable all tracing when SNA starts by issuing snap start -t. To perform internal tracing using the Motif administration program, complete the following steps: Step 1. Enter xsnapadmin from the command line to start the Motif administration program and display the main window. Step 2. Select the Diagnostics menu, then select Node tracing. The Tracing dialog is displayed. Step 3. Select All Tracing to perform internal tracing. Step 4.
Using Logging and Tracing Tracing • To activate tracing on one or more of the following message types, specify one or more of the following values. Use a + character to combine values: APPC Messages sent between the APPC library and the node. FM Messages sent between the 3270 emulation program and the node. LUA Messages sent between the LUA library and the node. NOF Messages sent between the NOF library and the node. MS Messages sent between the MS library and the node.
Using Logging and Tracing Tracing Internal Trace File Contents Internal tracing produces binary trace file output that you can format into text files by using the snaptrcfmt utility. You can filter the output by using the snapfilter utility. For more information about these utilities, see Appendix A, “Using snapfilter and snaptrcfmt.
Using Logging and Tracing Tracing 100 Chapter 3
A Using snapfilter and snaptrcfmt Appendix A 101
Using snapfilter and snaptrcfmt Overview Overview Some types of tracing create binary output. SNAplus2 provides tools for filtering and formatting these binary files. This appendix describes how to: • Filter binary trace output to extract only the information you need by using the snapfilter utility. • Format binary trace output into text files by using the snaptrcfmt utility.
Using snapfilter and snaptrcfmt Filtering Internal Tracing Filtering Internal Tracing The snapfilter utility enables you to select specific entries from an unformatted, internal trace file so that you can extract only the information you need to diagnose a particular problem. For example, if the trace file contains many different trace types (messages traced at different interfaces within SNAplus2), you can select only messages of a particular type or remove all messages of a particular type.
Using snapfilter and snaptrcfmt Filtering Internal Tracing • LUA • NOF • MS • DLC • DLPI • SDLC • NLI • NDLC (node to DLC messages) • NODE • SLIM (messages sent between master and backup servers in a client-server system) • DGRM (SNAplus2 internal control messages) Do not specify both +point and -point . If you do not specify either option, the default is +point ALL . -point tracetype Exclude messages of the type or types specified.
Using snapfilter and snaptrcfmt Filtering Internal Tracing Include APPC or CPI-C messages with the specified conversation ID (in hexadecimal); exclude other APPC or CPI-C messages. This option has no effect on messages other than APPC or CPI-C messages. To specify more than one conversation ID, separate them with commas. Do not specify both +convid and -convid . -convid XXXXXXXX Exclude APPC or CPI-C messages with the specified conversation ID (in hexadecimal). Do not specify both +convid and -convid .
Using snapfilter and snaptrcfmt Filtering Internal Tracing session; you cannot filter on messages in a single direction only. For example, if messages flowing from the node have OAF = 01, DAF = 02, and ODAI = 1, messages flowing to the node on the same session will have OAF = 02, DAF = 01, and ODAI = 1. Specifying +lfsid 01021 includes messages flowing in both directions on this session. You can use both of the options +lfsid and -lfsid . -lfsid aabbc Exclude DLC messages with the specified LFSID.
Using snapfilter and snaptrcfmt Filtering Internal Tracing only messages between the specified times. The end time you specify must be later than the start time. -end yymmddhhmmss Exclude messages traced after the specified date and time. Use the same format as -start. You can specify both -start and -end to include only messages between the specified times. The end time you specify must be later than the start time.
Using snapfilter and snaptrcfmt Formatting Internal Binary Trace Output into Text Files Formatting Internal Binary Trace Output into Text Files The snaptrcfmt command-line utility enables you to format binary trace output into one or two text files. It can be used either for line tracing or for internal tracing, with slightly different options in each case. • For line tracing, you can format the binary trace output into only one text file, a message data dump file.
Using snapfilter and snaptrcfmt Formatting Internal Binary Trace Output into Text Files detailed SDLC tracing, this suppresses information fields and includes only address and control fields. -D Produce a more detailed report of each message. -l Suppress detailed SDLC tracing if it is included in the trace file (but include standard SDLC line trace). If you do not select this option, any detailed SDLC tracing from the trace file will be included in the output.
Using snapfilter and snaptrcfmt Formatting Internal Binary Trace Output into Text Files Only create the message data dump file. Do not specify any of the following options with the -W option. -b Include a listing of each message as it is sent by one component and received by another. If you do not specify this option, SNAplus2 includes only sent messages. -r Include only raw hexadecimal data for each message; do not attempt to interpret the message data. Do not specify both of the options -r and -d .
Using snapfilter and snaptrcfmt Formatting Internal Binary Trace Output into Text Files Only create the message flow drawing. Do not specify any of the following options with the -w option. -c component_group Compress a group of components into one column so that messages between these components do not appear in the drawing. Specify one or more of the following separated by commas: CP Compress control point into one column. LU Compress LU 6.2 components (CPI-C and APPC) into one column.
Using snapfilter and snaptrcfmt Formatting Internal Binary Trace Output into Text Files you must specify -c before -s . -s components Do not display a column in the drawing for one or more individual components. Any messages flowing to or from these components are shown in the “unknown” column, so you can view detailed information without having to display all the components in a group. For example, you can view the PS and HS components but suppress the RM component.
Using snapfilter and snaptrcfmt Formatting Internal Binary Trace Output into Text Files Message flow drawing A drawing showing the messages flowing between different SNAplus2 components (this format does not apply to line tracing). Message data dump A listing of the data in each trace message. Message Flow Drawing Each column in the message flow drawing corresponds to a particular SNAplus2 component or to a group of components.
Using snapfilter and snaptrcfmt Formatting Internal Binary Trace Output into Text Files The following 3270 emulation program and RJE workstation program and API components: AL APPC library CL CPI-C library CV CSV library FL FM library (used by 3270) RL RUI (LUA) library ML MS library NL NOF library CD Config daemon LD Log daemon SD SNA daemon RD RCF daemon BS Backlevel remote system (client-server messages) RS Remote system (client-server messages) SIX 114 Appendix A
Using snapfilter and snaptrcfmt Formatting Internal Binary Trace Output into Text Files The following internal components (except DLCs) outside APPN protocol code: PM Path manager SV Service manager AP, TP APPC internal components LO Log internal component M MS internal component N NOF internal component L1, L2 LUA internal components FM FM internal component DP Backlevel client-server Presentation Services CP Control point, which consists of: CM Session connector manager NF NOF node component AM, AS Addres
Using snapfilter and snaptrcfmt Formatting Internal Binary Trace Output into Text Files Configuration services DS Directory services MD Multiple Domain Support (MDS) component of management services MS Management services SS Session services TR Topology and routing services DR, ES Dependent LU Requester (DLUR) LU LU 6.
Using snapfilter and snaptrcfmt Formatting Internal Binary Trace Output into Text Files Conventional half-session LM LU manager PU PU manager PX PU concentration NO The following node components (components of APPN protocol code): BM Buffer manager DLC DLC component within a node PC Path control SC Session connector DL DLC components, which consist of: ND, LC, MC NDG driver SL SDLC driver HM SDLC hardware interface QL QLLC driver X2 Appendix A 117
Using snapfilter and snaptrcfmt Formatting Internal Binary Trace Output into Text Files X.25 interface (NLI) In addition to grouping components together, you can also suppress the column for a particular component or group. Any messages flowing to or from this component are shown as flowing to or from the “unknown” column, which is marked ?? (as shown in the “Message Flow Drawing Example”). Each line in the drawing ends with a number prefixed with a $ character, followed by a timestamp.
Using snapfilter and snaptrcfmt Formatting Internal Binary Trace Output into Text Files • Uninterpreted hexadecimal data • Hexadecimal data interpreted as EBCDIC and as ASCII • Hexadecimal data interpreted as EBCDIC and as ASCII, with text interpretations of many of the message fields.
Using snapfilter and snaptrcfmt Formatting Internal Binary Trace Output into Text Files Message Data Dump Example for Line Tracing with Maximum Detail ------------------------------------------------ 16:54:33.950 BST 20 Apr 1999 SND>> CNCT_OUT REQ ETHER0.ETSAP0.ETHL0 IPS: 00000000 4554484C 30202020 010000EE .......<........ ....ETHL0 .... 01000008 00000007 000629EA BC670400 ................ ..........)..g.. 00000000 00000000 00000000 00000000 ................ ................
Using snapfilter and snaptrcfmt Formatting Internal Binary Trace Output into Text Files 000E0007 00020040 00050000 00000000 ....... ........ .......@........ 00000000 00000000 00000000 00000000 ................ ................ 00000000 00000000 00000000 00000000 ................ ................ 0000000A 0005000A 00051388 13880064 ...........h.h.. ...............d 000A001E 001E0003 ........ ........ ------------------------------------------------ 16:54:33.960 BST 20 Apr 1999 SND>> XID (NULL) TOKEN0.
Using snapfilter and snaptrcfmt Formatting Internal Binary Trace Output into Text Files DLC data length = 0B Byte 19 = 41 XID sender can be an ABM combined station XID sender not already using short-hold mode Short-hold mode not supported Sender is secondary link station (non-negotatiable) Link-station transmit-receive capability: two-way simultaneous Byte 20 = 00 XID sender is not the sender of a nonactivation XID Maximum BTU length = 409 Byte 23 = 00 SNA link profile Byte 24 = 00 SIM and RIM not supported
B Windows Clients Appendix B 123
Windows Clients Overview Overview This appendix describes logging and tracing information that is specific to Windows clients.
Windows Clients Logging for Windows Clients Logging for Windows Clients Logging for Windows clients is controlled by options in the Registry for Win32 as described in the HP-UX SNAplus2 Administration Guide. Problem and exception messages are logged to the error log file, and audit messages are logged to the audit log file. Problem messages are always logged and cannot be disabled, but you can specify whether to log exception and audit messages.
Windows Clients Controlling Tracing on Windows Clients Controlling Tracing on Windows Clients On a Windows client, SNAplus2 provides facilities for API tracing, 3270 message tracing, and client-server tracing. Options in the Registry for Win32 control all of these trace types. For more information, refer to the HP-UX SNAplus2 Administration Guide.
Index Numerics 3270 emulation program cannot print, 49 fails to start, 46 file transfer not working, 48 tracing, 95 3270 emulation program problems cannot establish session to the host, 46 cannot transfer files, 48 fails to start, 46 incorrect characters on screen, 48 3270 emulation program tracing, 26, 94 3270 message tracing, 96 3270 tracing trace file format, 96 A alerts, 20, 27 API tracing collecting, 83 sample API trace file fragment, 89 setting up, 82 trace file format, 86, 96 uses of, 25 APPC applica
Index L LANG environment variable specifying, 48 line tracing, 25, 78 controlling, 79 formatting binary trace file, 81 link station fails to start, 37 Ethernet, 39 FDDI, 39 QLLC, 38 SDLC, 38 Token Ring, 39 local logging, 68 log file, 20 log files backing up, 69 controlling size, 69 resetting, 69 Windows client, 125 log format, 70 log messages, 22 cause and action information, 75 recommended actions, 24 what to log, 68 logging central, 68 changing names and locations of log files, 67 local, 68 succinct loggi
Index RJE workstation is inactive, 51 servers administration problems, 56 what to check first, 33 process ID, 86, 96 program error messages, 20, 21 using to resolve problems, 58 ps utility, 60 PU concentration session problems, 54 Q QLLC link station fails to start , 38 R reporting problems, 57 resolving common problems, 32 3270 emulation file transfer not working, 48 3270 emulation printing not working, 49 3270 emulation program, 46 APPC applications are not working, 52 check communication with other SNA
Index size, 85 trace format utility command format, 108 message data dump options, 110 message flow drawing options, 111 output options, 111 trace output formatting, snaptrcfmt, 108 samples, 86, 96 trace types, 78 line tracing, 78 tracing, 20, 24 3270 emulation program tracing, 26, 94, 95, 96 API tracing, 25 application programs, 83, 84 client-server tracing, 26, 90 collecting 3270 emulation program trace files, 94 collecting API trace, 83 collecting RJE workstation trace files, 94 controlling API tracing