
HP Process Resource Manager User's Guide


PRM configuration planning
Using prmanalyze to quickly identify resource use
Chapter 3 83
Instead of adding a user record for each of these users, you could create
only one user record. This record would be for a new netgroup you define,
say finance_dept. The netgroup would include these users. Using a
netgroup also simplifies updates when the staff changes. For more
information on using netgroups in user records, see “Specifying PRM
users” on page 139.
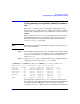
Step 5. Use prmanalyze to create a summary memory report, sorted by
command:
# prmanalyze -s command -r mem -p -t summary -1 filename
summary memory report by command name : 2231 records processed
unique id processes ave KB peak KB KB minutes % total
mrkt_rsch 804 270.83 3132517.22 4273171.32 1.17
financials 759 4356.04 389279.46 107851933.76 29.53
f90com32 843 11921.09 16621.58 5003627.94 1.37
web_browser 98 8832.73 1076302.48 4930582.36 1.35
emacs 12 7.13 5009.34 3980988.79 1.09
vi 1743 7.00 7123.54 3688806.00 1.01
sales_fcst 779 349.81 1933.62 62490565.66 17.11
Based on this report, we can assign memory shares of 30 and 2 to the
Finance and Web PRM groups respectively. The peak usage is also worth
noticing. The web_browser application has a peak of approximately one
Gbyte. This should be capped at 25% to prevent it from consuming too
much memory. Also, the research program peaks at three Gbytes,
causing poor response time for everyone. With a total of 4 Gbytes on the
system, its group needs to be limited. The Research PRM group is
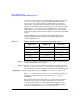
consequently capped at 50%. Table 3-3 shows the configuration updated
for memory management.
Table 3-3 Initial configuration based on prmanalyze’s memory report
Application PRM group CPU shares
Memory
shares
Memory
cap
mrkt_rsch Research 35 10 50%
financials Finance 20 30
web_browser Web 5 2 25%
sales_fcst Sales 18 20
OTHERS 22 38