
HP PAK Performance Analysis Tools User's Guide


Chapter 4 33
XPS Overview, Options, and Commands
XPS Overview
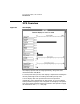
When you invoke the xps command, you will see a display like that
shown in Figure 4-1.
The Process Name section provides the names of your processes. By
default, XPS groups all other user processes under Other Processes
and all operating system processes under OS Processes. To expand
Other Processes and display the processes individually, use the -p
option. To expand OS Processes and display the processes individually,
use the -l1 option.
The I/O Type section provides the following information:
Network The number of network messages sent or received per
second within the sample interval.
Disk The number of disk reads or writes per second within
the sample interval.
The Network I/O Type section provides the following information:
Paging Requests The number of requests to read or
write per second from the monitoring
machine within the sample interval.
Paging Services The number of requests received to
read or write per second from other
machines within the sample interval.
Other Traffic The number of network messages
sent or received per second that are
unrelated to paging requests and
paging services within the sample
interval.
NOTE XPS is provided as an analysis tool for programmers. If you are
interested in monitoring system performance on an ongoing and regular
basis, we recommend that you use the HP GlancePlus product.