
HP PAK Performance Analysis Tools User's Guide


32 Chapter 4
XPS Overview, Options, and Commands
XPS Overview
XPS Overview
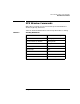
Figure 4-1 XPS Display
XPS displays process and I/O usage dynamically, using a bar chart
interface based on OSF/Motif.
For each process that you own, XPS displays a separate bar showing the
relative percentage of CPU time being consumed by that process.
You can display other user processes and OS server processes
individually, with a separate bar for each process. Or, you can collapse
these processes into groups, with a single bar for each group. The options
that control these and other features are listed in “XPS Options” on page
34 and online on the xps(1) man page.