
HP PAK Performance Analysis Tools User's Guide


Chapter 1 5
Overview of HP PAK Tools
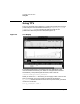
Using Puma
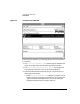
• Select Call Tree Analysis to display a given performance
metric relative to the libraries and routines that executed during
the sample set.
• Select Playback Thread States to step through the stack trace
of multi-threaded programs (on systems that support
kernel-threaded applications).
❏ The Messages box displays any run-time messages generated by
Puma.
For More Information
See Chapter 2, “Puma Concepts,” for more information on how Puma
collects data and generates statistics.
See the puma(l) man page.
Detailed online help on all of Puma's functions is available from Puma's
Help menus. The online help also includes a tutorial that guides you
through data collection and analysis.
Here are a few tips on using Puma's online help:
• To browse the Puma Help volume, begin by selecting
Help:Introduction in the main Puma window and then follow
hyperlinks throughout the volume.
• To find help on using a particular window or dialog box, click on the
Help menu or button in that display.
• To find help on a particular screen item (button, list box, etc.), select
Help:On Item in the main Puma window and then click on the
desired item in any Puma window.
• To find information on searching and printing helpfiles, select
Help:On Help in the main Puma window.