
HP PAK Performance Analysis Tools User's Guide


4 Chapter 1
Overview of HP PAK Tools
Using Puma
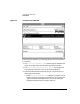
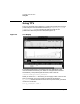
Figure 1-1 The Main Puma Window
The Puma main window is your starting point for all Puma activities.
For example:
❏ The Collect Performance Data button brings up windows that
guide you through the process of collecting performance data.
❏ The Collected Performance Data (Files) list box displays
Puma data files that exist in the current working directory.
❏ The three buttons below the list box give you a choice of ways to
display performance data:
• Select Pan/Zoom Resource Use to display a program's use of
system resources over time in line-graph form. On systems that
support kernel-threaded applications, you can also view how
individual kernel threads use system resources.