
HP-MPI User's Guide (11th Edition)

Profiling
Using the profiling interface
Chapter 4 179
Using the profiling interface
The MPI profiling interface provides a mechanism by which
implementors of profiling tools can collect performance information
without access to the underlying MPI implementation source code.
Because HP-MPI provides several options for profiling your applications,
you may not need the profiling interface to write your own routines.
HP-MPI makes use of MPI profiling interface mechanisms to provide the
diagnostic library for debugging. In addition, HP-MPI provides tracing
and lightweight counter instrumentation. For details, refer to
• “Using counter instrumentation” on page 175
• “Using the diagnostics library” on page 201
The profiling interface allows you to intercept calls made by the user
program to the MPI library. For example, you may want to measure the
time spent in each call to a certain library routine or create a log file. You
can collect your information of interest and then call the underlying MPI
implementation through an alternate entry point as described below.
All routines in the HP-MPI library begin with the MPI_ prefix.
Consistent with the “Profiling Interface” section of the MPI 1.2 standard,
routines are also accessible using the PMPI_ prefix (for example,
MPI_Send and PMPI_Send access the same routine).
To use the profiling interface, write wrapper versions of the MPI library
routines you want the linker to intercept. These wrapper routines collect
data for some statistic or perform some other action. The wrapper then
calls the MPI library routine using its PMPI_ prefix.
Fortran profiling interface
When writing profiling routines, do not call Fortran entry points from C
profiling routines, and visa versa. In order to profile Fortran routines,
separate wrappers need to be written for the Fortran calls.
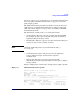
For example:
#include <stdio.h>
#include <mpi.h>
int MPI_Send(void *buf, int count, MPI_Datatype type,