
HP-MPI User's Guide (11th Edition)

Profiling
Using counter instrumentation
Chapter 4 177
the file as compute_pi, as you did when you created the instrumentation
file in “Creating an instrumentation profile” on page 175, you would
print compute_pi.instr.
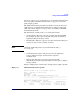
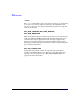
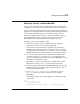
The ASCII instrumentation profile provides the version, the date your
application ran, and summarizes information according to application,
rank, and routines. Figure 4-1 on page 177 is an example of an ASCII
instrumentation profile.
The information available in the prefix.instr file includes:
• Overhead time—The time a process or routine spends inside MPI.
For example, the time a process spends doing message packing or
spinning waiting for message arrival.
• Blocking time—The time a process or routine is blocked waiting for a
message to arrive before resuming execution.
NOTE Overhead and blocking times are most useful when using -e
MPI_FLAGS=y0.
• Communication hot spots—The processes in your application
between which the largest amount of time is spent in
communication.
• Message bin—The range of message sizes in bytes. The
instrumentation profile reports the number of messages according to
message length.
Figure 4-1 displays the contents of the example report compute_pi.instr.
Figure 4-1 ASCII instrumentation profile
Version: HP MPI 01.08.00.00 B6060BA - HP-UX 11.0
Date: Mon Apr 01 15:59:10 2002
Processes: 2
User time: 6.57%
MPI time : 93.43% [Overhead:93.43% Blocking:0.00%]
-----------------------------------------------------------------
-------------------- Instrumentation Data --------------------
-----------------------------------------------------------------
Application Summary by Rank (second):
Rank Proc CPU Time User Portion System Portion
-----------------------------------------------------------------
0 0.040000 0.010000( 25.00%) 0.030000( 75.00%)
1 0.030000 0.010000( 33.33%) 0.020000( 66.67%)