
STM Online Help: xstm Online Help (graphical interface)
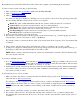

2. Go to the Tools Menu pulldown in the Main Menu Bar.
3. Move the cursor to the Information cascade menu.
4. Select Information Log....
The Information Log for the chosen device is displayed.
Top
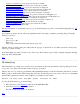
Interpret the Icons on the System Map
The easiest way to determine the status of a device is by observing its icon on the system map, and noting its color, as
well as any text displayed with the icon. The following is a list of icon colors with their meanings:
Status Icon Color Description
------ ---------- -----------
(blank) Blue The device has not been tested
Testing Light Blue Testing is in progress
QUERY PENDING Orange Query waiting; click icon to respond
SUSPENDED Yellow Suspended by the user
HUNG Yellow The operation has hung
ABORTED Yellow The operation was aborted
WARNING Yellow The operation completed, with warnings in the Tool Activity
Log
INCOMPLETE Yellow The operation could not be completed
FAILURE Red The most recent operation failed
Success Green The most recent operation succeeded
Top
View Device Status
The fastest way to determine the status of a device is to Interpret the Icons on the System Map. For more information,
you can view the Current Device Status:
1. Go to the Device Menu pulldown in the Main Menu Bar.
2. Select Current Device Status.
A window will be displayed, which will inform you of the results (e.g., "Success" or "Failure") for the most
recently executed tool, and will recommend further action, as appropriate.
The window also lists all the tools available for the device.
Top
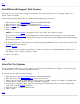
View STM Logs (All Available)
xstm allows you to view the following logs:
UI Activity Log: Log of errors encountered by xstm
Map Log: Log of events during system map build
System Activity Log: Log of all xstm operations performed
Information Log: Log of device-specific ids/descriptions
Information Tool Activity Log: Log of most recent run of device info tool
Information Tool Failure Log: Error log for most recent run of device info tool