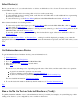
xstm Online Help On Tasks Preparation Running Tools Getting Information Troubleshooting STM On Item Main Window System Map On Menus and Commands File System Device Tools Options Help The Support Tools Manager (STM) allows you to run various support tools on one or more PA-RISC/IA64 machines. Support tools include information modules, verifiers, diagnostics, exercisers, firmware update tools, expert tools, and utilities.
STM has been designed so that the support tools can be run on the local machine or on remote machines. The computer running the user interface is the UI system, and the computer being tested is the Unit Under Test or UUT. You can run the user interface and the support tools on the same machine. In this case, the UI machine and the UUT are one and the same. You can also run the STM user interface on one machine, and from it, run support tools on one or more remote machines.
By default, the test system (Unit Under Test) is the same as the computer system running the user interface. To select a remote system for testing, do the following: 1. Move your cursor to the System Menu pulldown in the Main Menu Bar. 2. Click on Sel System to Test.... 3. Click on Select Current System.
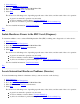
Top Install/Deinstall Support Tool Licenses Most support tools do not require a support tool license. A few of the advanced tools (for example, expert tools) require a license from HP. The following procedure tells you how to install and deinstall support tool licenses: 1. 2. 3. 4. 5. Move the cursor to the System Menu pulldown in the Main Menu Bar. Move the cursor to the License cascade menu selection. Click on Install. (Only HP personnel should click on Install HP-Only.) Enter your password.
Select Device(s) Before you can run a tool, you select the device or devices on which the tool is to be run. You can select a device in several different ways: To select a specific device for testing, click on its icon on the system map. To select multiple devices for testing, click on the first icon and shift-click on each additional icon, representing the devices you want to test. To select all devices go to the Device Menu pulldown in the Main Menu Bar and click on Select All.
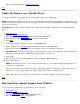
1. 2. 3. 4. 5. Select Device(s). If desired, Select/Set Test Options. Go to the Tools Menu pulldown in the Main Menu Bar. Move the cursor to the Verify cascade menu. Select Run. The device icon will change color, depending upon the state of the device, and the result of the tool's operation: A green icon means the operation was successful. A red icon indicates a device failure. View the Failure Log. A yellow icon indicates a problem running the tool. View a Tool's Activity Log.
For more detailed information, View Device Status. Top Update the Firmware on a Specific Device To update the firmware on a specific device, run a firmware update tool on the device: NOTE: The firmware update process is device-specific. This means that while the user interface to the update process remains consistent, the specifics of the process for a given device may vary considerably. This procedure is an example only, using a SCSI disk.
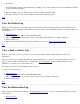
5. Select Run. The "Run Utility" window will be displayed, prompting you to select a utility from a list of all utilities for which you have licensing privileges. 6. Select one utility (only one utility may be selected at a time), and click "OK". 7. The utility will open a new window with its own menu bar and help system. Top View the Failure Log When a tool has detected a device failure, the icon for the device in the system map turns red and displays the word "FAILURE".
2. Go to the Tools Menu pulldown in the Main Menu Bar. 3. Move the cursor to the Information cascade menu. 4. Select Information Log.... The Information Log for the chosen device is displayed. Top Interpret the Icons on the System Map The easiest way to determine the status of a device is by observing its icon on the system map, and noting its color, as well as any text displayed with the icon.
Verify Tool Activity Log: Log of most recent run of verifier Verify Tool Failure Log: Error log for most recent run of verifier Diagnose Tool Activity Log: Log of most recent run of diagnostic Diagnose Tool Failure Log: Error log for most recent run of diagnostic Exercise Tool Activity Log: Log of most recent run of exerciser Exercise Tool Failure Log: Error log for most recent run of exerciser Firmware Update Tool Activity Log: Log of most recent run of FW update tool Firmware Update Tool Failure Log: Erro
Map Log The Map Log contains a record of what transpired while the system map was being built. The log dialog box allows you to view, save, and print the contents of the log, as desired. The log is created at boot time, and whenever the Remap System command is executed. To view the Map Log, do the following: 1. Move the cursor to the System Menu pulldown in the Main Menu Bar. 2. Select the Map Log menu selection. The "Map Log" window is displayed.
support tool against a specific device. The log dialog allows you to view, save, and print the contents of the log, as desired. To view the Information Tool Activity Log for a particular device, do the following: 1. Go to the Tools Menu pulldown in the Main Menu Bar. 2. Move the cursor to the Information cascade menu. 3. Select Activity Log.... The "Tool Activity Log" for the Information tool will be displayed.
1. Go to the Tools Menu pulldown in the Main Menu Bar. 2. Move the cursor to the Verify cascade menu. 3. Select Failure Log.... The "Tool Failure Log" for the Verify tool will be displayed. Top Diagnose Tool Activity Log The Diagnose Tool Activity Log allows you to review details of the most recent execution of the Diagnose support tool against all selected devices. The log dialog allows you to view, save, and print the contents of the log, as desired.
Top Exercise Tool Failure Log The Exercise Tool Failure Log allows you to review details of failures encountered during the most recent execution of the Exercise support tool against all selected devices. The log dialog allows you to view, save, and print the contents of the log, as desired. To view the Exercise Tool Failure Log for all selected devices, do the following: 1. Go to the Tools Menu pulldown in the Main Menu Bar. 2. Move the cursor to the Exercise cascade menu. 3. Select Failure Log....
Expert Tool Activity Log The Expert Tool Activity Log allows you to review details of the most recent execution of the Expert Tool support tool against all selected devices. The log dialog allows you to view, save, and print the contents of the log, as desired. To view the Expert Tool Tool Activity Log for all selected devices, do the following: 1. Go to the Tools Menu pulldown in the Main Menu Bar. 2. Move the cursor to the Expert Tool cascade menu. 3. Select Activity Log....
To view the Utility Tool Failure Log for all selected devices, do the following: 1. Go to the Tools Menu pulldown in the Main Menu Bar. 2. Move the cursor to the Utility cascade menu. 3. Select Failure Log.... The "Tool Failure Log" for the Utility tool will be displayed. Top Troubleshooting the Support Tools Manager Occasionally, you may have problems running the Support Tools Manager.
Top Device listed as "Unknown" in map The Map Log should indicate the cause of this problem, as well as what do about it. You can determine if you have an old version of STM by checking the Release Notes at /usr/sbin/stm/Rel_NOTES.STM. HP personnel can file an SR, use product number B4708AA and product name STM. NOTE: Be sure to include the information from the Map Log and ioscan -kf commands.
HP personnel can file an SR, use product number B4708AA and product name STM. NOTE: Be sure to include the information from the System Activity Log, prod_op_xref file, Current Device Status, and Current License Level. Top UI cannot connect to a system One indication that you have encountered this situation is that an invalid user name or password error will be displayed to you. If "ping" works for the IP address, but not for the hostname, use the IP address.
If any of the above conditions is true, update the "diagmond" configuration so that it waits longer before marking a tool as "HUNG" (the default wait time is 4 minutes). If a tool stays in the "HUNG" state, determine if there is an error by examining the activity log for the tool you are running (e.g., Verify Tool Activity Log) for errors, and/or to determine the last time the tool logged, compared to the current time. You may also want to examine the process, using the "ps -ef" command.
System Map Main Window The main window displays the system map, which provides configuration information, test status, and forward progress indicators, as appropriate. It is also the starting point for accessing all other system functions and commands. System Map The easiest way to determine the state of a device is by observing its icon on the system map, and noting its color, as well as any text displayed with the icon.
------------------Start Recording... Stop Recording Record Output-> ------------Start Recording... Stop Recording Record Map Administration-> -------------Read UUT Config File Update Tool Info STM Startup STM Shutdown Local UUT Logs-> Local UUT Logs-> -------------Map Log System Activity Log syslog -----------------Connect to Systems... Select Current System... Disconnect Systems... License-> ------Display Install... Install HP-Only... Deinstall Daemons-> ------Daemon Startup... Daemon Shutdown...
Administration...: Menu for managing xstm and its configuration Exit: To leave xstm Top Save Config... Use this function to save the state of the user interface in a specified file. The following items will be saved: All items in the General... and Map... dialogs (Options Menu) All items in the Tool Options Menu screens: Information Verify Diagnose Exercise Firmware Update Expert Tool Utility See also Restore Config....
window; e.g., "/users/username/config.stm". Click on "OK" and the configuration will be restored from that file. Top Record Command File... By using this function, you can record the functions executed by the interface in a file you specify, or you can toggle recording off. xstm operations are recorded as a series of cstm (command line interface of the Support Tools Manager) functions which can be read by: the Run Command File... function the -f initiation option, or automatically from the .stmrc file.
Cancel If you no longer wish to run the currently executing command file, select "Cancel". Top Record Output... During any xstm session, you can use this function to save the cstm (command line version of the Support Tools Manager) version of the terminal output functions generated by the session to a file of your choice. The output will show both the functions executed and the output they produced.
Top Administration... Use the Administration cascade menu to manage the diagnostic system and its configuration, including the following functions: Causing the diagmond daemon on the current test system to reread its configuration file Causing the list of available tools for the selected device to be reread Causing the diagnostic system to be shut down locally, i.e., on the machine on which the xstm is running.
Top Record Output Menu The Record Output Menu has three selections: Start Recording: Enable recording of terminal output Stop Recording: Disable recording of terminal output Record Map: Save the system device map Top Start Recording You use this function to enable terminal output recording. You must specify a file in which to save the record thus produced; alternatively, you can append the record to an existing file. Once recording begins, the function is unavailable until recording is disabled.
Top Update Tool Info Use this function to have the list of available tools for a selected device reread. This provides the basic functionality for incorporating a newly installed support tool into the xstm. Top STM Startup Use this function to start the diagnostic system on the local machine, i.e., the machine on which the xstm is running, when you are logged on as root. Top STM Shutdown Use this function to shut down the diagnostic system on the local machine, i.e.
Top Map Log Use this function to view the Map Log on the local Unit Under Test (UUT), without having to be connected to the xstm machine. See also Local UUT Logs and System Activity Log. Top System Activity Log Use this function to view the System Activity Log on the local Unit Under Test (UUT), without having to be connected to the xstm machine. See also Local UUT Logs and Map Log.
Top Connect to Systems Use this function to maintain a list of test systems, and to connect to those chosen. The Host information portion of the dialog contains the list of test systems available, and may be edited. When adding a test system, only the system name need be specified. The OS and OS Revision are automatically determined, to provide the necessary information prior to system connection. Multiple systems may be selected, and are connected when the dialog is finished using "OK".
choose from the list of connected test systems. Only one test system can be selected by this function at a time; the list of test systems may be edited. When you choose a system to be the current test system, it is automatically connected to the xstm, whenever possible, if it is not already connected. When a new system becomes the current test system, all the displays are altered to reflect the status of this new system.
Use this function to write an ASCII copy of the device map to a specified file. File You enter the path (i.e., directory) and filename of the file to which you wish to save the current device map. You may specify wild cards (file filters), if you wish. For example, you might enter the following: "/users/username/*.map". Once you click on "Apply Filter", you will see all the "/users/username" directories on the system displayed in the "Directories" window; similarly, all files with a ".
License This cascade provides the ability to install licenses for running support tools, including an HP-Only license valid only for the current session. It also provides the functionality for deinstalling these licenses on the current test system.
In order to determine the level of access granted you by the system on which you have installed your support tools license, you must enter a password at this time, and then select "OK" to proceed. If you do not want to continue with the password installation, select "Cancel" instead. The password you type is not displayed on the screen. Top Install HP-Only Use this function to install the HP-Only license.
Daemon Startup Use this command to initiate a daemon on the test machine. When invoked, a listing of all available STM daemons on the UUT (excluding diagmond) is displayed. Top Daemon Shutdown Use this command to abort a daemon on the test machine. When invoked, a listing of all available STM daemons on the UUT (excluding diagmond) is displayed. Top Daemon Kill Use this key to kill a daemon on the test machine.
Use this function to display all known information for the selected devices, including current status, and to receive suggestions on further actions which you might take at this point. The data displayed for each device includes the following: A description of the device The hardware path, specifying the address of the hardware components leading to the device The device type (e.g, disk, tape) The device qualifier (e.g.
"Devices" is defined as "Device Type/Device Qualifier." "Device Type," and "Device Qualifier" are displayed by the Current Device Status command. Examples of "Devices" include: Adapter/Bus Disk/CDROM Disk/Hard Interface/Centronics Interface/Keyboard Interface/LAN Interface/RS-232 Interface/SCSI Memory/Memory Processor/CPU Tape/DDS Don't select anything if you do not want to use the device type and qualifier to select devices. "Products" is defined as "Product (Qualifier).
This command will select all devices which are the same product as those devices which are already selected. Select Devices Above This command will select all devices which are in the hardware path between the system processing unit and the selected devices. If, for example, a SCSI disk is selected, then using this command will also cause the SCSI interface card and any I/O or bus adapters to which this card is connected to also be selected.
"Products" is defined as "Product (Qualifier)." "Product" and "Qualifier" are displayed in the device map and by the Current Device Status command. Examples of "Products" include: Built-in Keyboard/Mouse (2e) Bus Adapter (580) CPU (5a1) SCSI Disk (SEAGATE31200N) SCSI Tape (HP35480A) Don't select anything if you do not want to use the product to deselect devices. Unselect Device Type and Qualifier Scroll through the "Device Type and Qualifier" window to the device type and qualifier you wish to deselect (e.
Top Information Use this function to create a log of information specific to each selected device, which has an information function, including: The product identifier A description of the device The hardware path to the device The vendor Typically, the firmware revision code, if firmware is present in the selected devices, will also be displayed. The information tool runs on all selected devices that are not currently busy.
To diagnose a selected device or devices, the target device(s) must not only support diagnostics, it must also currently be idle. When you first start to diagnose a device(s), the device(s) state on the device map will be changed to "RUNNING". If the operation requires you to interact with the interface, the device state will change to "Query Pending". If the UI started the tool, the query will display automatically.
can make the device permanently unusable and data could be lost. CAUTION: It is not advisable to interrupt or abort the firmware update functions. Top Expert Tool Use this function to invoke the expert tool for the selected device. Expert tools are device-specific troubleshooting utilities for use by sophisticated users. Their functionality varies from tool to tool, but they are intended to be interactive, and rely on you to provide information necessary to perform a particular task.
To select the device, move the cursor to the appropriate device address in the "Select Device" window and click on it; then click on "OK". Select Utility Select a utility to run from the list displayed, then select "OK" to proceed. If you choose not to continue with utility selection and execution, select "Cancel" instead. Utility Information This dialog allows you to select a utility from a list, and get more information about it.
Information Log... Use this function to view the log(s) generated by an Information request on all selected devices for which an information log exists. This function only exists on the cascade menu for the Information tool. Top Activity Log... Use this function to review the log which contains details concerning the most recent invocation of a tool on all selected devices. The function is valid only when a Tool Activity Log for the tool exists for the selected device(s). Top Failure Log...
Suspend Tool Use this function to momentarily halt execution of a support tool running on all selected devices. Suspending an interactive tool causes the tool's window to freeze. See also Resume Tool. Top Resume Tool Use this function to restart execution of a suspended tool running on all selected devices. See also Suspend Tool. Top Abort Utility Use this function to halt execution of a utility running under the xstm. Only one utility from the list of utilities can be selected at a time.
For tools which are not in the "abort pending" state, you should first try Abort Tool. Top Kill Utility Use this function to kill a utility which is in the "abort pending" state, but which doesn't manage to abort properly (see also Kill Tool). For utilities which are not in the "abort pending" state, you should first try Abort Utility. Top Options Menu The Options Menu has three selections: Tool Options: Menu for launching tools and utilities Map...: Configure device map options General...
The "Map Refresh Rate" field allows you to specify how often (in seconds) the device map is to be updated; the default is every 2 seconds. When the user interface is being run on a system other than the system under test, the device map information is sent between the systems at this rate.
Select this checkbox when you want to show how many complete repetitions of a non-interactive tool test are left to complete. Last Operation Status/Percent Complete This field indicates the progress of the currently running tool, as a measure of percentage of execution completed. If no tools are running, it indicates the status of the last tool that was run.
See also Tool Launch. Queries are Displayed Immediately The "Queries are Displayed Immediately" checkbox controls the behavior of queries. When a non-interactive support tool attempts to display a query, the question will be presented to you immediately, provided the checkbox is set. If the checkbox is not set, the status is changed to "Query Pending", but xstm does not automatically display the query.
UI Activity Log The radio buttons under this heading allow you to specify the verbosity of the UI Activity Log contents generated by the interface. You may specify that only errors be logged, that errors and warnings be logged, or that errors, warnings, and information messages be logged. Report Only Errors Click on this radio button if you want to keep a log of all errors encountered by a selected tool.
Use this function to configure the options which will be used for subsequently executed information tools, including: Defining the contents of the Activity Log... Allowing/disallowing user queries By clicking on an individual checkbox, and then pressing F1, you can get help on that particular item.
Top Verify Use this function to configure the options which will be used for subsequently executing verify tools, including: Execution iterations, timeouts, and looping Behavior on errors Extent of test coverage Contents of the Verify Tool Activity Log Allowing/disallowing user queries By clicking on an individual checkbox, and then pressing F1, you can get help on that particular item.
failure log and exit, no matter how this option is set). You may choose to exit the tool on finding an error, you may terminate test execution after a certain number of errors have been encountered, or you may choose to continue tool execution in spite of encountering an error. Exit on Error Select this radio button if you want a specified tool to exit on encountering an error.
Click on this radio button if you want to keep a log of all errors encountered by a selected tool, and all warnings and information messages generated as a result of tool activity.
User Queries You may select whether to interact with a specified tool, or to use the tool's default information values, depending upon which of the following radio buttons you select: * Allow * Disallow (Non-Destructive) * Disallow (Destructive) Alternatively, you can go to the "Help" pulldown menu in the Main Menu Window Bar, and click on "On Item"; the cursor will change to a "?". In the example above, you then move the cursor to the "User Queries" checkbox, and click on the checkbox with your mouse.
Maximum Select this radio button when you want to diagnose system hardware as thoroughly you can. Note that selecting this level of coverage may require significantly longer execution time for some devices. Medium Select this radio button when you want to diagnose system hardware with a moderate degree of confidence. Minimum Select this radio button when you want to diagnose system hardware, but only to the minimum standard level of adequacy and acceptance.
When you click on this radio button, you can disable the "User Queries" function, and run the tool both noninteractively and non-destructively. Disallow (Destructive) When you click on this radio button, you will perform DESTRUCTIVE tests non-interactively. You will see the following WARNING message displayed: WARNING: You have set the User Queries option to enable destructive tests.
Select this radio button if you want to define the length of time the exercise test procedure is to run (in minutes), before it halts. Loop Continuously Select this radio button if you want the exercise test procedure to repeat until you halt or abort it. Behavior on Errors Using the radio buttons associated with this heading, you can define the way in which you want a specified tool to behave on encountering a "soft" error; e.g.
Once you have clicked on this checkbox, you may move to the "Allow User Queries" checkbox, or click on "OK". Report Only Errors Click on this radio button if you want to keep a log of all errors encountered by a selected tool. Report Only Errors and Warnings Click on this radio button if you want to keep a log of all errors encountered by a selected tool, and all warnings generated as a result of tool activity.
Firmware Update Use this function to configure the options which will be used for subsequently executing firmware update tools, including: Selecting/applying update directory/file filters Defining the contents of the Activity Log... Allowing/disallowing user queries Update File You enter the path (i.e., directory) and filename of the file from which you wish to load the updated firmware information. You may specify wild cards (file filters), if you wish.
Click on this checkbox if you want to keep a log of all actions performed by a selected tool. The associated radio buttons will let you specify whether or not you want to log only errors, errors and warnings, or errors, warnings, and information. Once you have clicked on this checkbox, you may move to the "Allow User Queries" checkbox, or click on "OK". Report Only Errors Click on this radio button if you want to keep a log of all errors encountered by a selected tool.
Top Tool Launch Use this function for assistance in debugging and testing tools developed for the xstm. The function is enabled by using the "Tool Developer Launch Options" checkbox of the General... function under the Options Menu. The dialog box contains two checkboxes to enable Debug and Test Modes. NOTE: Both modes may be enabled at the same time. Debug mode is used to provide information for the Distributed Debugging Environment (DDE) debugger.
Top Help Menu The Help Menu has five selections: On Item: For help on a particular interface item On Tasks: For help on commonly performed procedures On Application: For an overview of xstm On Help: For a description of the help facility On Version: To display current interface version banner Top On Item Select help "On Item" to obtain further information on a particular interface feature or function.
This command displays version information for the current xstm interface. Top Dialog Help The section is devoted to dialog help messages. Top Command File Input If the command file input displayed on your screen is correct, and you wish to proceed, select "OK". If the command file input displayed on your screen is not correct, then select "Cancel" instead. Top Information Dialog Once you have read the information message displayed on the screen, select "OK" to continue.
Top File Viewer This window displays a file. Options allow you to save the file, print the file, exit the file viewer ("Done"), or access the help function. Top Log Format Error There are messages logged in the file, that were not found in the catalog, or file formatting was truncated. Select "OK" to proceed. Top Cancel Log Formatting If you do not wish to format your log file, or wish to stop formatting at this time, select "Cancel".
please contact the system administrator for the system you wish to connect to. Top Logon Name You have requested connection to a system that you selected. Please enter your logon account name at this time. If you do not have an account on the selected system, or can't remember your logon name, please contact the system administrator for the system you wish to connect to. Top Logon Password You have requested connection to a system that you selected. Please enter your logon password at this time.
Error Condition You have encountered an error condition. If you are advised to consult a log, please do so at this time. To proceed, select "OK". Top Input Error You have made a mistake in entering your input.
Print Tool Window Use this function to print a copy of the tool's main window to a specified printer. The list of available printers includes all those configured on the system on which the xstm is being run. Print Tool Window Printer: To print out a hardcopy of the tool's main window to a particular printer, select a printer from the list displayed in the "Printer" window; then click on "OK".