
Online Diagnostics (EMS and STM) Administrator's Guide September 2012


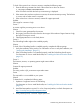

Table Of Contents
- Online Diagnostics B.11.31.19.04 Administrator Guide
- Contents
- 1 Introduction
- Overview
- Hardware Monitoring
- Support Tools Manager
- OnlineDiag Bundle Media
- 2 Installing the Online Diagnostics Software
- 3 Configuring and Administering EMS Hardware Monitors
- Configuring the Fibre Channel Monitors
- Hardware Monitoring Request Manager
- Configuring Hardware Monitoring
- Running the Monitoring Request Manager
- Enabling Monitoring
- Listing Monitor Descriptions
- Viewing Current Monitoring Requests
- Adding a Monitoring Request
- Modifying a Monitoring Request
- Verifying Hardware Event Monitoring
- Checking Detailed Monitoring Status
- Retrieving and Interpreting Event Messages
- Deleting Monitoring Requests
- Disabling Monitoring
- Peripheral Status Monitor
- Configuring the Peripheral Status Monitor
- 4 Administering the Support Tools Manager
- 5 Troubleshooting Online Diagnostics
- Glossary
- Index
- 6 Support and other resources
- 7 Documentation feedback
3. Select Filters->Display->Raw to filter and view the entries in a raw log file.
4. Enter the preferred settings.
5. Select Filters->Display->Formatted to filter and view the entries in a formatted log file.
6. Enter the preferred settings.
Filtering a Log File Using the cstm Interface
To filter entries in a log file using the cstm interface, complete the following steps:
1. Enter the following command at the Logtool Utility prompt to filter the entries while formatting
a log file:
Logtool Utility>format
2. Enter the following command at the Logtool Utility prompt to filter and view the entries in a
raw log file:
Logtool Utility>displayraw
3. Enter the following command at the Logtool Utility prompt to filter and view the entries in a
formatted log file:
Logtool Utility>displayformatted
Running the Logtool 65