
Online Diagnostics (EMS and STM) Administrator's Guide September 2012


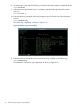
Table Of Contents
- Online Diagnostics B.11.31.19.04 Administrator Guide
- Contents
- 1 Introduction
- Overview
- Hardware Monitoring
- Support Tools Manager
- OnlineDiag Bundle Media
- 2 Installing the Online Diagnostics Software
- 3 Configuring and Administering EMS Hardware Monitors
- Configuring the Fibre Channel Monitors
- Hardware Monitoring Request Manager
- Configuring Hardware Monitoring
- Running the Monitoring Request Manager
- Enabling Monitoring
- Listing Monitor Descriptions
- Viewing Current Monitoring Requests
- Adding a Monitoring Request
- Modifying a Monitoring Request
- Verifying Hardware Event Monitoring
- Checking Detailed Monitoring Status
- Retrieving and Interpreting Event Messages
- Deleting Monitoring Requests
- Disabling Monitoring
- Peripheral Status Monitor
- Configuring the Peripheral Status Monitor
- 4 Administering the Support Tools Manager
- 5 Troubleshooting Online Diagnostics
- Glossary
- Index
- 6 Support and other resources
- 7 Documentation feedback
3. Select the device that you want to test using the device number or the device path. For example,
to select the SCSI Disk (SEAGATEST31200), enter the following command at the cstm prompt:
cstm>sel dev 5
or
cstm>sel path 32.11.0
An asterisk (*) sign to the left of the device number indicates the device you selected, as shown
in Figure 4-15.
Figure 20 Selecting a Device (cstm Interface)
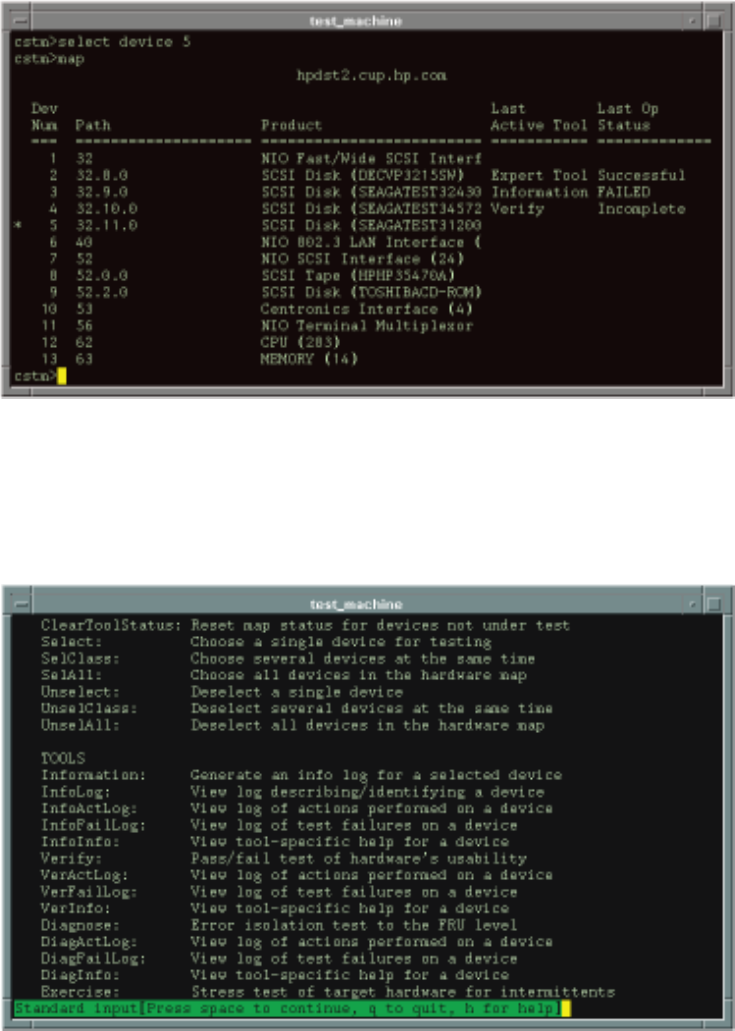
4. Enter the following command at the cstm prompt for a list of commands to run various tools:
cstm>help more
The list of commands is displayed, as shown in Figure 4-16.
Figure 21 Running a Test (cstm Interface)
5. Enter the name of the tool at the cstm prompt to run a test, as shown in the following example:
cstm>verify
58 Administering the Support Tools Manager