
Online Diagnostics (EMS and STM) Administrator's Guide September 2012


Table Of Contents
- Online Diagnostics B.11.31.19.04 Administrator Guide
- Contents
- 1 Introduction
- Overview
- Hardware Monitoring
- Support Tools Manager
- OnlineDiag Bundle Media
- 2 Installing the Online Diagnostics Software
- 3 Configuring and Administering EMS Hardware Monitors
- Configuring the Fibre Channel Monitors
- Hardware Monitoring Request Manager
- Configuring Hardware Monitoring
- Running the Monitoring Request Manager
- Enabling Monitoring
- Listing Monitor Descriptions
- Viewing Current Monitoring Requests
- Adding a Monitoring Request
- Modifying a Monitoring Request
- Verifying Hardware Event Monitoring
- Checking Detailed Monitoring Status
- Retrieving and Interpreting Event Messages
- Deleting Monitoring Requests
- Disabling Monitoring
- Peripheral Status Monitor
- Configuring the Peripheral Status Monitor
- 4 Administering the Support Tools Manager
- 5 Troubleshooting Online Diagnostics
- Glossary
- Index
- 6 Support and other resources
- 7 Documentation feedback
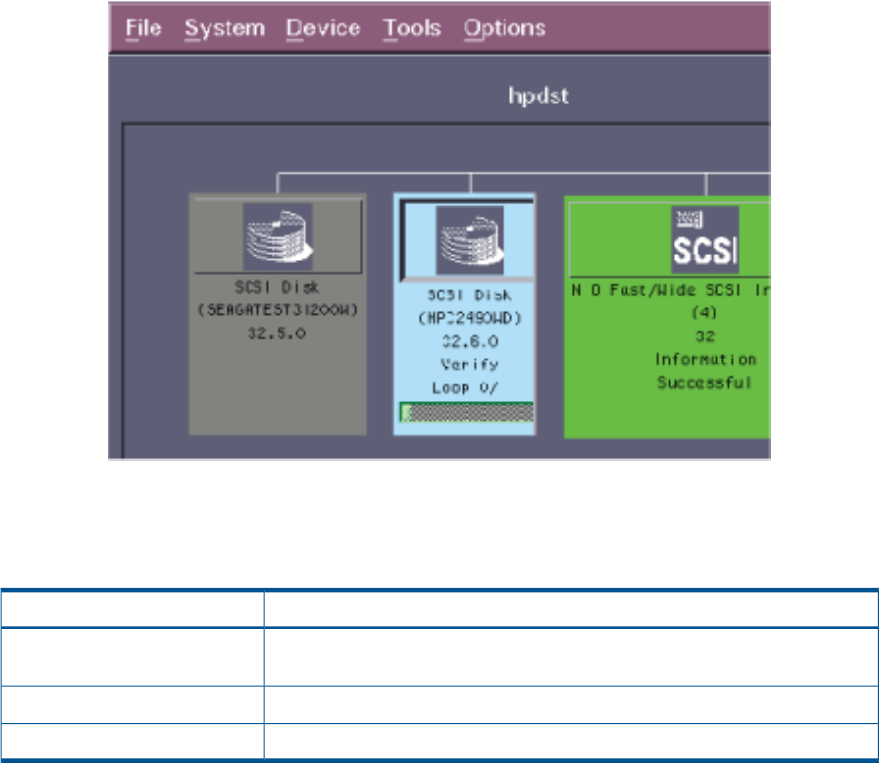
Figure 10 Monitoring Test Progress (xstm Interface)
The color of the device on the device map changes when the test is complete. Table 4-1
describes the significance of each color.
Table 20 Test Results (xstm Interface)
DescriptionColor
Indicates that the test completed successfully and that the device is functioning
properly.
Green
Indicates that the test is not complete and that the device might have problems.Yellow
Indicates that the test is complete but that the device failed the test.Red
5. If the device failed the test, select the device and select Tools->Tool name->Failure Log.
The cause of the failure is displayed, as shown in Figure 4-6.
52 Administering the Support Tools Manager