
Online Diagnostics (EMS and STM) Administrator's Guide September 2012


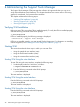


Table Of Contents
- Online Diagnostics B.11.31.19.04 Administrator Guide
- Contents
- 1 Introduction
- Overview
- Hardware Monitoring
- Support Tools Manager
- OnlineDiag Bundle Media
- 2 Installing the Online Diagnostics Software
- 3 Configuring and Administering EMS Hardware Monitors
- Configuring the Fibre Channel Monitors
- Hardware Monitoring Request Manager
- Configuring Hardware Monitoring
- Running the Monitoring Request Manager
- Enabling Monitoring
- Listing Monitor Descriptions
- Viewing Current Monitoring Requests
- Adding a Monitoring Request
- Modifying a Monitoring Request
- Verifying Hardware Event Monitoring
- Checking Detailed Monitoring Status
- Retrieving and Interpreting Event Messages
- Deleting Monitoring Requests
- Disabling Monitoring
- Peripheral Status Monitor
- Configuring the Peripheral Status Monitor
- 4 Administering the Support Tools Manager
- 5 Troubleshooting Online Diagnostics
- Glossary
- Index
- 6 Support and other resources
- 7 Documentation feedback

Running Support Tools
You can run the support tools to obtain device-specific information, perform stress tests, and so on.
This section addresses the following topics:
• “Running a Support Tool Using the xstm Interface” (page 49)
• “Running a Support Tool Using the mstm Interface” (page 53)
• “Running a Support Tool Using the cstm Interface” (page 57)
• “Running a Support Tool in Special Modes” (page 61)
Running a Support Tool Using the xstm Interface
To run a support tool using the xstm interface, complete the following steps:
1. Enter the following command at the HP-UX prompt:
# /usr/sbin/xstm
The system map is displayed, as shown in Figure 4-1.
Figure 6 System Map (xstm Interface)
Running Support Tools 49