
Online Diagnostics (EMS and STM) Administrator's Guide September 2012


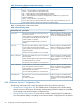
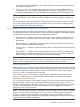

Table Of Contents
- Online Diagnostics B.11.31.19.04 Administrator Guide
- Contents
- 1 Introduction
- Overview
- Hardware Monitoring
- Support Tools Manager
- OnlineDiag Bundle Media
- 2 Installing the Online Diagnostics Software
- 3 Configuring and Administering EMS Hardware Monitors
- Configuring the Fibre Channel Monitors
- Hardware Monitoring Request Manager
- Configuring Hardware Monitoring
- Running the Monitoring Request Manager
- Enabling Monitoring
- Listing Monitor Descriptions
- Viewing Current Monitoring Requests
- Adding a Monitoring Request
- Modifying a Monitoring Request
- Verifying Hardware Event Monitoring
- Checking Detailed Monitoring Status
- Retrieving and Interpreting Event Messages
- Deleting Monitoring Requests
- Disabling Monitoring
- Peripheral Status Monitor
- Configuring the Peripheral Status Monitor
- 4 Administering the Support Tools Manager
- 5 Troubleshooting Online Diagnostics
- Glossary
- Index
- 6 Support and other resources
- 7 Documentation feedback

Hardware Monitoring Request Manager
This section addresses the following topics:
• “Default Monitoring Requests ” (page 27)
• “EMS Hardware Monitor Configuration Files” (page 28)
• “File Locations ” (page 31)
Default Monitoring Requests
A set of default monitoring requests is available for each monitor. These default requests provide
complete monitoring and protection for the hardware resources under the control of the monitor.
Table 3-1 describes the default monitoring requests that are common for all monitors.
Table 9 Default Monitoring Requests for Each Monitor
Default Notification MethodSeverity Levels
textlog: /var/opt/resmon/log/event.logAll
syslogMAJOR WARNING, SERIOUS,
CRITICAL
consoleMAJOR WARNING, SERIOUS,
CRITICAL
Note: Messages are not sent to the console by default.
E-MAIL address: rootMAJOR WARNING, SERIOUS,
CRITICAL
NOTE: To gain greater control over what notification methods are used to alert you when events
occur, you must modify or add new monitoring requests. You can add new notification methods
or remove those that are not required. Creating custom monitoring requests also enables you to
manage which severity levels you want reported.
Table 3-2 describes the monconfig settings.
Table 10 Monitoring Request Configuration Settings
DescriptionSetting
Identifies the severity level used in conjunction with the criteria operator to generate an event
message.
Criteria Thresholds
Identifies the arithmetic operator used with the criteria threshold to control the events that are
reported. Following are the valid operators:
< (less than)
<= (less than or equal to)
Criteria Operators
> (greater than)
>= (greater than or equal to)
! (not equal to)
Following are the numeric values corresponding to each severity level:
CRITICAL = 5
SERIOUS = 4
MAJOR WARNING = 3
MINOR WARNING = 2
INFORMATIONAL = 1
The criteria operators enable you to direct events of several severity levels using the same
notification method. For example, to direct both SERIOUS and CRITICAL events using the same
method, you must use the condition >= SERIOUS.
Following are the available notification methods:
E-MAIL — Sends notification to the specified e-mail address
textlog — Sends notification to the specified file
Notification Method
Hardware Monitoring Request Manager 27