Online Diagnostics B.11.31.19.
© Copyright 2012 Hewlett-Packard Development Company, L.P. Legal Notices ©Copyright 2012 Hewlett-Packard Development Company, L.P.Confidential computer software. Valid license from HP required for possession, use or copying. Consistent with FAR 12.211 and 12.212, Commercial Computer Software, Computer Software Documentation, and Technical Data for Commercial Items are licensed to the U.S. Government under vendor's standard commercial license.
Contents 1 Introduction ..............................................................................................6 Overview ...............................................................................................................................6 Hardware Monitoring................................................................................................................6 Event Monitoring Service.................................................................................................
Enabling Monitoring .........................................................................................................32 Default Monitoring Requests ..........................................................................................32 Listing Monitor Descriptions ................................................................................................33 Viewing Current Monitoring Requests ...................................................................................
Troubleshooting Online Diagnostics............................................................66 Troubleshooting EMS Hardware Monitors .................................................................................66 Glossary....................................................................................................68 Index.........................................................................................................70 6 Support and other resources.....................................
1 Introduction This chapter introduces you to the Online Diagnostics software and the tools that it contains. This chapter addresses the following topics: • “Overview ” (page 6) • “Hardware Monitoring” (page 6) • “Support Tools Manager” (page 10) • “OnlineDiag Bundle Media” (page 12) Overview The Online Diagnostics software is a collection of tools that enables you to monitor and test server hardware.
EMS Hardware Monitors require minimal maintenance once installed and configured. They automatically monitor new hardware resources that are added to the system. The EMS Hardware Monitors also integrate with applications that maintain system availability, such as HP Serviceguard. Startup Client The Startup Client launches and configures the EMS Hardware Monitors each time you start the system and after you execute the IOSCAN utility.
to DOWN. If it is, the PSM alerts the EMS, and the EMS notifies HP Serviceguard about the change in status. The EMS manages all PSM monitoring requests. Some monitors can determine when a problem is corrected. These monitors automatically alert the PSM when the hardware they are monitoring is fixed, and the PSM returns the state of the hardware to UP. Other monitors cannot determine when the hardware problem is fixed.
Table 1 Monitors Native Providers dm_sas_adapter HPUXSASNativeIndicationProviderModule dm_raid_adapter HPUXRAIDSANativeIndicationProviderModule dm_fclp_adapter HPUXFCNativeIndicationProviderModule dm_ql_adapter disk_em HPUXStorageNativeProviderModule msamon_sas Difference Between Hardware Event Monitoring and Hardware Status Monitoring The EMS Hardware Monitors detect errors, but they do not retain the details of events. However, the error can persist until it is rectified.
Support Tools Manager The Support Tools Manager (STM) manages a collection of support tools that you can use to verify and troubleshoot system hardware.
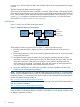
Figure 2 STM Architecture Command Lin e Menu based X-Windows based UI Syste m User Interfac e diagmon d Syste m Under Tes t Exerciser s Expert Tool s Firmwar e updat e Informatio n Tool s Diagnosti c Tool s Utilitie s Verifier s STM performs the following tasks when you install the Online Diagnostics software: 1. The diagmond daemon maps the system hardware. 2. The diagmond daemon launches the STM daemons on the system.
Figure 3 Local Execution Control System and System Under Test STM User Interface STM Platform and Support Tools Commands, Message Identifiers, etc. Remote Execution In remote execution, you can run STM as a client server application. The user interface module and the support tools module are on separate systems. The user interface module is located on the control system, and the support tools module is located on the system under test. Figure 1-4 illustrates the remote execution architecture.
2 Installing the Online Diagnostics Software The Online Diagnostics software is installed by default with the HP-UX 11i Operating Environment (OE) media. However, at some point you may need to install or reinstall the software separately. This chapter describes how to install the Online Diagnostics software as a standalone component on HP-UX 11i operating systems.
Table 4 Disk Arrays (continued) Product Model/Product Number HP Fast/Wide SCSI Disk Array: Supported by Fast Wide C243XHA SCSI Disk Array Monitor (fw_disk_array) Special Requirements None HP Fibre Channel High-Availability Disk Array: Supported HP SureStore E Disk HP-UX 11i v1 (PHCO_26824) Array by Disk Array FC60 Monitor (fc60mon) FC60 HP StorageWorks Modular SAN Array 1000 HP StorageWorks Modular SAN Array 30 Supported by HP StorageWorks Modular SAN Array 1000 Monitor (msamon) HP StorageWorks Modular
Table 5 High-Availability Storage Systems (continued) Product Model/Product Number Special Requirements HP SureStore Disk System: Supported by High-Availability 2300 Storage System Monitor (dm_ses_enclosure) None HP SureStore Disk System: Supported by High-Availability 2405 Storage System Monitor (dm_ses_enclosure) None Fibre Channel SCSI Multiplexer Monitor (dm_fc_scsi_mux) supports A3308A HP Fibre Channel SCSI Multiplexer. The monitor requires firmware version 3840.
Table 6 Fibre Channel Adapters (continued) Product Model/Product Number Special Requirements http://www.hp.com/go/ hpux-diagnostics-docs HP Fibre Channel Mass Storage Adapters A7992A Supported by Raid Adapters Monitor (dm_raid_adapter) HP-UX 11i v1 September 2003 release of the Support Tools bundle or later For information about the driver and the STM versions required for the Fibre Channel host bus adapters, see the HP Support Center at: http://www.hp.
The Fibre Channel Arbitrated Loop Hub Monitor (dm_fc_hub) supports the following models of the Fibre Channel Arbitrated Loop (FC-AL) hubs. • A3724A • A4839A The FC-AL Hub monitor requires the following device firmware revisions: • Device Agent Firmware revision 2.14 or later • Hub Controller Firmware revision 3.06 or later Firmware and installation instructions are available at: http://www.hp.
Table 7 System (continued) Product Model/Product Number Special Requirements Low-Priority Machine Checks (LPMCs) on PA8500-based (PSCX-W) systems: Supported by LPMC Monitor (lpmc_em) NA None Intelligent Platform Management Interface (IPMI) Forward NA Progress Log (FPL) entries on the system: Supported by IPMI Forward Progress Log Monitor (fpl_em) All Itanium-based systems running HP-UX 11i v2 or later; All PA-RISC-based systems running March 2003 release of HP-UX 11i v2 or later.
Table 8 Other Supported Devices (continued) Product Model/Product Number Special Requirements • A2997B (1.8kVA) • A2998B (3.0kVA) • A3589B (5.5kVA) HP Power Trust II-LR • A1353A (2.0kVA and 120V) • A1354A (2.0kVA and 240V) • A1356A (3.0kVA and 240V) Explorer UPS HP Power Trust II-MR • A6583A (4.0kW and 240V) • A6584A (6.5kW and 240V) • A6585A (8.
# mount /dev/dsk/c1t2d0 /tmp/cdrom 3. Enter the following command at the HP-UX prompt: # swinstall The SD Install - Software Selection window is displayed. 4. In the Specify Source window, select the appropriate location and click OK. The SD Install - Software Selection window is displayed. 5. 6. In the SD Install - Software Selection window, select Options-> Autoselect dependencies when marking software. Select Enforce dependency analysis errors in agent, and click OK. The Note window is displayed.
2. 3. 4. 5. 6. 7. 8. 9. Search for Online Diagnostics. The Overview page is displayed. Go to the Installation page and review Prerequisites to ensure that your system meets the requirements. Select the Receive for Free >> option at the bottom right of the page. Select the appropriate release of the HP-UX operating system. Enter your registration information. Read and accept the terms and conditions. Click Next >> at the bottom right of the page.
3. For information about installation-related errors, enter the following command at the HP-UX prompt: # swjob -a log @ :/ For example: # swjob -a log iemlhamia-0005 @ iemlhamia.india.hp.com:/ Removing the Software This section describes how to remove the Online Diagnostics software using the TUI and the CLI. CAUTION: Removing the Online Diagnostics software makes your system vulnerable to failure.
Verifying Removal of the Software This section describes how to use the TUI and the CLI to verify whether the Online Diagnostics software is removed successfully. Verifying Removal Using the TUI To use the TUI to verify whether the Online Diagnostics software is removed successfully, complete the following steps: 1. Log in to the system as superuser. 2. Select Logfile in the Remove Window. If there are no errors in the Logfile, the Online Diagnostics software is removed successfully.
3 Configuring and Administering EMS Hardware Monitors This chapter describes how to configure and administer the EMS Hardware Monitors.
5. To monitor multiple hubs, repeat step 4 for each hub. For example, the following entries configure the monitor for three hubs: HUB_COUNT 3 HUB_1_IP_ADDRESS 192.0.2.0 HUB_2_IP_ADDRESS 192.0.2.1 HUB_3_IP_ADDRESS 192.0.2.2 6. 7. Save the file. To invoke the changes made to the hub configuration file, run the Enable Monitoring option even if monitoring is already enabled.
Replace n with the number of switches you want to monitor. For example, the following entry enables you to monitor five switches: SW_COUNT 5 4. Add the following entry to the file: SW_X_IP_ADDRESS nn.nn.nnn.nnn Replace X with the number 1, and replace nn.nn.nnn.nnn with the IP address of the switch that is designated as switch 1. Following is a sample of an entry: SW_1_IP_ADDRESS 192.0.2.1 5. To monitor multiple switches, repeat step 4 for each switch.
Hardware Monitoring Request Manager This section addresses the following topics: • “Default Monitoring Requests ” (page 27) • “EMS Hardware Monitor Configuration Files” (page 28) • “File Locations ” (page 31) Default Monitoring Requests A set of default monitoring requests is available for each monitor. These default requests provide complete monitoring and protection for the hardware resources under the control of the monitor.
Table 10 Monitoring Request Configuration Settings (continued) Setting Description SNMP — Sends notification using the SNMP traps console — Sends notification to the system console TCP — Sends notification to the specified target host and port UDP — Sends notification to the specified target host and port OPC — Sends notification to OpenView ITO applications (available only on systems with OpenView installed) syslog — Sends notification to the system log You can select only one notification method for each
to the monitor. The settings defined in the monitor-specific file override the settings defined in the Global Configuration File. • Client Configuration File: Multiple-View monitors enable you to create a different Client Configuration File for each target. Settings defined in the Client Configuration File override comparable settings defined in either the Global or the Monitor-Specific Configuration File.
Considerations for Modifying the Startup Configuration File Settings HP recommends that you use the monconfig utility to create and manage your monitoring requests. Using the monconfig utility, you can create requests for multiple monitors simultaneously. The monconfig utility ensures that all request entries are formatted correctly. Editing the configuration file enables you to use the COMMENT setting to add information that is included in the event.
Table 13 Startup Configuration File Target Entries (continued) Keyword COMMENT: (Optional) Values Description Target TCP Port Port number on the host that is used for network connection Target USERLOG Name of the log file to which TCP events are sent Target E-MAIL Address E-mail address of the recipient of the events Any text string An optional field, which is presented as user data for each event meeting this criterion File Locations Table 3-6 describes the files used in hardware monitoring.
• “Retrieving and Interpreting Event Messages ” (page 37) • “Deleting Monitoring Requests ” (page 38) • “Disabling Monitoring” (page 38) Running the Monitoring Request Manager To run the monconfig utility, complete the following steps: 1. Log in as superuser. 2.
Table 15 Default Monitoring Requests for Each Monitor Severity Levels Notification Method All textlog: /var/opt/resmon/log/event.log MAJOR WARNING, SERIOUS, CRITICAL syslog MAJOR WARNING, SERIOUS, CRITICAL console MAJOR WARNING, SERIOUS, CRITICAL E-MAIL address: root Note: Messages are not sent to the console by default. NOTE: To gain greater control over the notification methods, you must modify or add new monitoring requests.
with severity >= MAJOR WARNING to SYSLOG 3) Send events generated by all monitors with severity >= MAJOR WARNING to EMAIL root Hit to continue... Adding a Monitoring Request Each new notification method requires a separate monitoring request. You can add monitoring requests only at the monitor level, which creates an identical request for all instances of the hardware resources supported by the monitor. You cannot add monitoring requests for a specific hardware instance.
The following example illustrates the process of adding a monitoring request. In this example, a request which is added that sends all CRITICAL events detected by the AutoRAID Disk Array monitor to admin@hp.com.
Client Configuration File: (C)lear (A)dd Use Clear to use the default file. Enter selection {or (Q)uit,(H)elp} [c] c New entry: Send events generated by all monitors /storage/events/disk_arrays/AutoRAID with severity = CRITICAL to EMAIL admin@hp.
Events >= 4 (MAJOR WARNING) Goto EMAIL; addr=root Events = 5 (CRITICAL) Goto TCP; host=hpbs1266.boi.hp.com port=53327 For /adapters/events/FC_adapter/8_12.8: Events >= 1 (INFORMATION) Goto TEXTLOG; file=/var/opt/resmon/log/event.log Events >= 4 (MAJOR WARNING) Goto SYSLOG Events >= 4 (MAJOR WARNING) Goto EMAIL; addr=root >/connectivity/events/multiplexors/FC_SCSI_mux ... NOT MONITORING. (Possibly there is no hardware to monitor.) >/system/events/memory ... OK.
Repair or replace the device, as necessary. =-+-=-+-=-+-=-+-=-+-=-+-=-+-=-+-=-+-=-+-=-+-=-+-=-+-=-+-=-+-=-+-=-+-=-+-=-+-= Deleting Monitoring Requests You can delete monitoring requests for a hardware resource that is removed from your system. However, you must delete only requests that are created exclusively for the removed resource. CAUTION: Deleting monitoring requests makes your system vulnerable to undetected hardware failures.
PSM Components PSM is installed along with the EMS Hardware Monitors. PSM comprises the following components: • The psmctd daemon — The Peripheral Status Client or target daemon used to monitor the status of hardware resources. • The psmmon utility — A utility used to monitor the status of resources recognized by the psmctd daemon. • The set_fixed utility — The utility used to manually change the status of a hardware resource from DOWN to UP.
Table 17 PSM Configuration File Fields (continued) Keyword Values MONITOR_STATE_HANDLING (optional) Following are the valid values: Description Identifies the type of state handling the monitor performs. • NO_UP_CONTROL (default) — The monitor uses the severity mapping of events to control the DOWN state. The UP state is controlled by the set_fixed command. • UP_STATE_CONTROL — The monitor uses the severity mapping of events to control the DOWN state. The monitor itself controls the UP state.
Table 18 PSM Status (continued) Option Description at a time, and with long polling intervals of several minutes or hours. Otherwise, it affects system performance. Determining the Frequency of Events — When you select When value is … from the options, the window is displayed. You must select one or more options listed in Table 3-11 to specify the frequency of events. Table 3-11 describes the options for the frequency of events.
A specified severity level other than Normal is returned under the following conditions: • The When value is … condition is TRUE. • The When value changes condition is TRUE. For more information about configuring notification severity levels, see the HP OpenView IT/Operations Administrators Task Guide at: http://www.hp.com/go/hpux-networking-docs) You can also find templates for configuring ITO and network node events at: http://www.hp.com/go/ha To set the opcmsg ITO, complete the following steps: 1.
The TCP and UDP Options Both of these options send TCP or UDP encoded events to the target host name and the port specified for the specified request. To set the TCP or UDP options, complete the following steps: 1. Select TCP or UDP, as appropriate, in the list. 2. Specify the target host name and the port. The E-mail Option The e-mail option sends events to the specified e-mail address. To set e-mail notification, complete the following steps: 1.
Configuring HP Serviceguard Package Resource Dependencies with the PSM PSM enables you to create HP Serviceguard package dependencies for resources monitored by EMS Hardware Monitors. To use the PSM with HP Serviceguard, you must configure one or more of the resource instances available in PSM as HP Serviceguard package dependencies. This creates an EMS monitoring request that monitors the status of the resource and alerts HP Serviceguard if the status of the resource changes.
Copying Monitoring Requests You copy monitoring requests for the following reasons: • To create requests for multiple resources using the same monitoring parameters. • To create requests for the same resource using different monitoring parameters. This enables you to create requests that send events using multiple notification methods.
2. Select Remove Monitoring Request in the Actions menu. A Confirmation window is displayed. 3. Click OK. A message indicating that the new request is removed and the EMS main window are displayed. To start monitoring the resource again, you must recreate the request either by copying a similar request for a similar resource or by re-entering the details. Viewing Monitoring Requests To view the parameters for a monitoring request, complete the following steps: 1.
1. Configure settings on one system using the monconfig utility. The monitor /var/stm/config/tools/monitor/*.sapcfg file is created. 2. Modify the following configuration files, if required: • /var/stm/config/tools/monitor/*.cfg, default_*.clcfg • /var/stm/config/tools/monitor/Global.cfg • /var/stm/data/tools/monitor/ NOTE: 3. If you do not choose to modify these configuration files, the default values are used. Copy all the /var/stm/config/tools/monitor/*.cfg, default_*.clcfg, and *.
4 Administering the Support Tools Manager The Support Tools Manager (STM) manages the collection of support tools that you can use to verify and troubleshoot system hardware. This chapter describes how to start and run STM using graphical, menu-based, and command-line interfaces.
Running Support Tools You can run the support tools to obtain device-specific information, perform stress tests, and so on.
2. Select the device you want to test in the system map, as shown in Figure 4-2. Figure 7 Selecting a Device (xstm Interface) 3. Select Tools->Tool name->Run to run a test, as shown in Figure 4-3. Figure 8 Running a Test (xstm Interface) NOTE: Some support tools do not support all devices on every operating system. For more information on the tools that support various devices, see the STM Online Help at: http://www.hp.com/go/hpux-diagnostics-docs 4.
Figure 9 Selecting the Type of Test (xstm Interface) The color of the device on the device map changes to blue when the test begins. Figure 4-5 shows the progress indicator. CAUTION: Selecting a Read-Write Test option can destroy the information on the disk. You must select the Read-Write Test option to check if the writing operation is functioning properly on new, unused disks. However, a Read-Only Test option only reads the information on the disk. This test does not affect the information on the disk.
Figure 10 Monitoring Test Progress (xstm Interface) The color of the device on the device map changes when the test is complete. Table 4-1 describes the significance of each color. Table 20 Test Results (xstm Interface) 5. Color Description Green Indicates that the test completed successfully and that the device is functioning properly. Yellow Indicates that the test is not complete and that the device might have problems.
Figure 11 Failure Log (xstm Interface) 6. Read the details in the Failure Log and take appropriate actions.
1. Enter the following command at the HP-UX prompt: # /usr/sbin/mstm The system map is displayed, as shown in Figure 4-7. Figure 12 System Map (mstm Interface) 2. Select the device you want to test in the device map, and click Enter or Select/Deselect, as shown in Figure 4-8. Figure 13 Selecting a Device (mstm Interface) 3. 54 Select Tools->Tool name->Run to run a test, as shown in Figure 4-9.
Figure 14 Running a Test (mstm Interface) NOTE: Some support tools do not support all devices on every operating system. For more information on the tools that support various devices, see the STM Online Help at: http://www.hp.com/go/hpux-diagnostics-docs 4. Select the type of test you want to run, as shown in Figure 4-10. Figure 15 Selecting the Type of Test (mstm Interface) CAUTION: Selecting a Read-Write Test option can destroy the information on the disk.
Figure 16 Monitoring Test Progress (mstm Interface) Table 4-2 describes the significance of each state. Table 21 Test Results (mstm Interface) 5. Status Description Successful Indicates that the test completed successfully and that the device is functioning properly. Incomplete Indicates that the test is not complete and that the device might have problems. Failed Indicates that the test is complete but that the device failed the test.
The cause of the failure is displayed, as shown in Figure 4-13. Figure 18 Failure Log (mstm Interface) 6. Read the details in the Failure Log and take appropriate actions. Running a Support Tool Using the cstm Interface To run a support tool using the cstm interface, complete the following steps: 1. Enter the following command at the HP-UX prompt: # /usr/sbin/cstm 2. Enter the following command at the cstm prompt: cstm>map The system map is displayed, as shown in Figure 4-14.
3. Select the device that you want to test using the device number or the device path. For example, to select the SCSI Disk (SEAGATEST31200), enter the following command at the cstm prompt: cstm>sel dev 5 or cstm>sel path 32.11.0 An asterisk (*) sign to the left of the device number indicates the device you selected, as shown in Figure 4-15. Figure 20 Selecting a Device (cstm Interface) 4.
NOTE: Some support tools do not support all devices on every operating system. For more information about the tools that support various devices, see the STM Online Help at: http://www.hp.com/go/hpux-diagnostics-docs 6. Select the type of test you want to run, as shown in Figure 4-17. Figure 22 Selecting the Type of Test (cstm Interface) CAUTION: Selecting a Read-Write Test option can destroy the information on the disk.
8. If a device fails a test, enter the following command at the cstm prompt to unselect all devices: cstm>unselall 9. Select the device that failed the test. For example, enter the following command to select device 3: cstm>sel dev 3 10. Enter the following command at the cstm prompt to view the Failure Log of the Information tool test: cstm>infofaillog The Failure Log is displayed, as shown in Figure 4-19. Figure 24 Failure Log (cstm Interface) 11.
Figure 25 Information Tool Activity Log (cstm Interface) 12. Read the details in the Information Tool Activity Log and take appropriate actions. Running a Support Tool in Special Modes You can use the advanced features of STM to increase your control over the test processes. For example, if your system experiences intermittent problems at random intervals, you can run the Exercise tool on all devices of the system for about 20 hours to rectify the problem.
2. Select Options->Tool Options->Exercise to select the tool, as shown in Figure 4-22. Figure 27 Selecting the Tool in Special Mode (xstm or mstm Interface) The list of options is displayed. 3. Enter the preferred settings. For information on how to run the tests and examine the results, see “Running Support Tools” (page 49). Running a Support Tool in Special Modes Using the cstm Interface To run the Exerciser tool for 20 hours using the cstm interface, complete the following steps: 1.
• “Filtering a Log File Using the xstm Interface” (page 64) • “ Filtering a Log File Using the mstm Interface” (page 64) • “Filtering a Log File Using the cstm Interface” (page 65) Formatting a Log File Using the xstm Interface To format a log file using the xstm interface, complete the following steps: 1. Enter the following command at the HP-UX prompt: # /usr/sbin/xstm The xstm interface is displayed. 2. Select Tools->Utility->Run to start the Logtool. A dialog box is displayed. 3. 4. 5.
5. Select the raw log file you want to format. Logtool displays a summary of events in the log file. NOTE: The log file currently being written to always ends with cur, for example, log_0002.raw.cur. However, the current log file is not created until an error is logged. Alternatively, you can click View->Raw Summary to view the summary of events in the log file. 6. 7. Select View->Raw Log to view all the contents in the log file. Select File->Format Raw to format the raw log file.
3. 4. 5. 6. Select Filters->Display->Raw to filter and view the entries in a raw log file. Enter the preferred settings. Select Filters->Display->Formatted to filter and view the entries in a formatted log file. Enter the preferred settings. Filtering a Log File Using the cstm Interface To filter entries in a log file using the cstm interface, complete the following steps: 1.
5 Troubleshooting Online Diagnostics This chapter describes how to troubleshoot the EMS Hardware Monitors. Troubleshooting EMS Hardware Monitors This section describes techniques for troubleshooting EMS Hardware Monitors. Problem The disk_em monitor generates events related to devices it does not monitor. Cause 1 The OnlineDiag bundle version installed on your system might be old and unsupported, and might continue to generate events related to unsupported devices.
To check if the monitor has a device to monitor, complete the following steps: 1. Enter the following command to check if the monitor has a device to monitor: # /etc/opt/resmon/lbin/moncheck A list of monitors and the devices they are monitoring is displayed. 2. 3. If the monitor does not have any device to monitor, the monitor must stop running. This behavior is correct, and no further action is required. If the monitor has a device to monitor, contact HP support personnel.
Glossary A-B asynchronous event detection An event-tracking method that enables a monitor to detect an event when it occurs, usually during an I/O to the device. C-D Client Configuration File A configuration file whose settings override comparable settings defined in either the Global or Monitor-Specific Configuration File. cstm An STM command to view the command-line interface. E EMS Hardware Monitors Daemons that proactively monitor hardware devices, such as CPU, memory, and hard disks.
N Non-Multiple-View monitors Monitors whose event details are the same for all the targets. O Online Diagnostics A collection of tools that enables you to monitor and test server hardware. OnlineDiag The name of the bundle that includes the Online Diagnostics software. P-R Peripheral Status Monitor A monitor that converts events detected by an EMS Hardware Monitor to a change in hardware resource status.
Index A adding FC switch, 26 FC-AL hub, 25 monitoring request, 34 C configuration file Client Configuration, 29 Global Monitor, 28 Monitor-Specific, 28 Startup, 29 configuring package dependencies editing the configuration file, 44 HP Serviceguard, 44 copying monitoring request, 45 D deleting monitoring request, 38 detailed monitoring status checking, 36 disabling hardware monitoring, 38 documentation providing feedback on, E EMS, 6 EMS Hardware Monitors, 6 asynchronous event detection, 7 default monitor
R removing FC switch, 26 FC-AL hub, 25 monitoring request, 45 swremove, 22 using the CLI, 22 using the TUI, 22 retrieving event message, 37 running support tool, 49 running a support tool exeroptions, 62 special modes, 61 running monconfig, 32 S special configuration FC switch monitor, 25 FC-AL hub monitor, 24 starting STM, 48 STM Failure Log, 52, 56 Read-Only Test, 51 Read-Write Test, 51 Support Tools Manager see STM U using set_fixed, 46 V verifying installation logfile, 21 STM, 48 swjob, 21 using the
6 Support and other resources About This Document This document describes how to install, administer, and troubleshoot the Online Diagnostics software and its components. Document updates may be issued between editions to correct errors or to document product changes. To ensure that you receive the updated or new editions, subscribe to the appropriate product support service. Contact your local HP sales representative for more information. You can also find this document at: http://www.hp.
Table 23 Publishing History (continued) Document Manufacturing Part Number Operating Systems Supported Publication Date 5992–1317 HP-UX 11i v1, HP-UX 11i v2, HP-UX 11i v3 September 2007 5991–6760 HP-UX 11i v1, HP-UX 11i v2, HP-UX 11i v3 February 2007 Document Organization The Online Diagnostics Administrator's Guide is organised as follows: Chapter 1–Introduction Introduces the Online Diagnostics software, hardware monitoring, the EMS Hardware Monitors and its architecture, and Support Tools Manager
| Separates items in a list of choices. HP-UX Release Name and Release Identifier Each HP-UX 11i release has an associated release name and release identifier. Theuname(1) command with the -r option returns the release identifier. The following table shows the releases available for HP-UX 11i: Table 24 HP-UX Releases Release Identifier Release Name Supported Processor Architecture B.11.11 HP-UX 11i v1 Intel® Itanium®, PA-RISC B.11.23 HP-UX 11i v2 B.11.
7 Documentation feedback HP is committed to providing documentation that meets your needs. To help us improve the documentation, send any errors, suggestions, or comments to Documentation Feedback (docsfeedback@hp.com). Include the document title and part number, version number, or the URL when submitting your feedback.