
Online Diagnostics (EMS and STM) Administrator's Guide March 2013


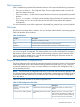

Client Configuration File:
(C)lear (A)dd
Use Clear to use the default file.
Enter selection {or (Q)uit,(H)elp} [c] c <== SPECIFY CLCFG FILE
IF DESIRED (USUALLY
CHOOSE DEFAULT)
New entry:
Send events generated by all monitors
/storage/events/disk_arrays/AutoRAID <== NEW MONITORING
with severity = CRITICAL to EMAIL admin@hp.com REQUEST
with comment:
This is a test message
Are you sure you want to keep these changes?
{(Y)es,(N)o,(H)elp} [n] y
Modifying a Monitoring Request
Modifying an existing monitoring request enables you to alter one of the settings used in the request.
You must select a monitoring request and change the preferred setting. All other aspects of the
request remain unchanged.
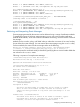
To modify a monitoring request, complete the following steps:
1. Run the monconfig utility by entering the following command at the HP-UX prompt:
# /etc/opt/resmon/lbin/monconfig
2. Enter Mat the main menu selection prompt.
All current monitoring requests are displayed.
3. From the list of current monitoring requests, enter the number of the request you want to modify.
4. Change the settings to achieve the desired results.
5. Save the request when prompted.
Verifying Hardware Event Monitoring
After creating the monitoring requests for your system, you must verify hardware event monitoring.
The most effective way of verifying hardware event monitoring is to simulate a hardware failure
or event. Depending on the hardware, you can do this by removing a disk from an array,
unplugging a cable, turning off the hardware resource, using known defective media, and so on.
The simulated fault must generate event messages using all the notification methods you have
specified. If it does not, check the monitoring requests and ensure that they are configured properly.
Checking Detailed Monitoring Status
The Detailed Monitoring Status option enables you to view detailed information about all active
monitoring requests. This information is organised by the resource instance. It lists all the monitoring
requests currently applied to each instance.
Unlike the Show Monitoring Requests option, which displays all the monitoring requests that are
created using the monconfig utility, the detailed status displays only the requests that are currently
active. For example, you can create a monitoring request for a monitor that is inactive. However,
it is not displayed in the list.
An inactive monitor is identified with a NOT MONITORING status. A monitor that does not have
resources to monitor is inactive.
NOTE: The PSM automatically creates the TCP monitoring request. This enables the TCP monitoring
request to gather event information from each monitor.
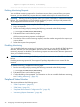
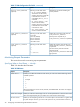
Following is a sample entry displayed for detailed monitoring status:
For /storage/events/disks/default/10_12_5.2.0:
Events >= 1 (INFORMATION) Goto TEXTLOG; file=/var/opt/resmon/log/event.log
Events >= 4 (MAJOR WARNING) Goto SYSLOG
36 Configuring and Administering EMS Hardware Monitors