
Online Diagnostics (EMS and STM) Administrator's Guide March 2012
Events >= 4 (MAJOR WARNING) Goto EMAIL; addr=root
Events = 5 (CRITICAL) Goto TCP; host=hpbs1266.boi.hp.com port=53327
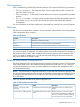
For /adapters/events/FC_adapter/8_12.8:
Events >= 1 (INFORMATION) Goto TEXTLOG; file=/var/opt/resmon/log/event.log
Events >= 4 (MAJOR WARNING) Goto SYSLOG
Events >= 4 (MAJOR WARNING) Goto EMAIL; addr=root
>/connectivity/events/multiplexors/FC_SCSI_mux ... NOT MONITORING.
(Possibly there is no hardware to monitor.)
>/system/events/memory ... OK.
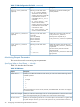
For /system/events/memory/49:
Events >= 1 (INFORMATION) Goto TEXTLOG; file=/var/opt/resmon/log/event.log
Events >= 4 (MAJOR WARNING) Goto SYSLOG
Events >= 4 (MAJOR WARNING) Goto EMAIL; addr=root
Events >= 4 (MAJOR WARNING) Goto TCP; host=hpbs1266.boi.hp.com port=53327
Retrieving and Interpreting Event Messages
Event messages generated by the monitors can be delivered using a variety of notification methods.
To simplify the process of receiving event messages, you can use e-mail or textlog notification
methods. Both methods, which are included in the default monitoring, receive the entire content of
the message.
Methods such as console, syslog, and SNMP alert you about the occurrence of an event, but they
do not deliver the entire message. You must retrieve the entire message using the resdata utility.
For these methods, the event includes a message similar to the following:
Execute the following command to obtain event details: /opt/resmon/bin/resdata
-R 392036357 -r /storage/events/tapes/SCSI_tape/10_12_5.0.0 -n 392036353 -a
You must execute the command exactly as described, specifying the two critical number fields that
are indices for the resdata entries.
Following is a portion of a sample event message:
> Event Monitoring Service Event Notification %<
Notification Time: Wed Sep 9 10:48:30 1998
hpbs8684 sent Event Monitor notification information:
/storage/events/disks/default/10_4_4.0.0 is >= 1.
Its current value is CRITICAL(5).
Event data from monitor:
Event Time : Wed Sep 9 10:48:30 1998
Hostname : hpbs8684.boi.hp.com IP Address : 15.62.120.25
Event Id : 0x0035f6b15e00000000 Monitor : disk_em
Event # : 100037 Event Class : I/O
Severity : CRITICAL
Disk at hardware path 10/4/4.0.0 : Media failure
Associated OS error log entry id(s):
000000000000000000
Description of Error:
The device was unsuccessful in reading data for the current I/O request
due to an error on the medium. The data could not be recovered. The
request was likely processed in a way which could cause damage to or loss
of data.
Probable Cause / Recommended Action:
The medium in the device is flawed. If the medium is removable, replace
the medium with a fresh one. Alternatively, if the medium is not
removable, the device has experienced a hardware failure.
Configuring Hardware Monitoring 37