
HP-UX Programming Tools Release Notes

24 Chapter4
Problem Descriptions and Fixes
Problems and Limitations
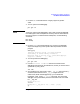
For example:
dde> s
Step interrupted by signal delivered to target.
Intercepted event type ’signal SIGCHLD’.
Signal received by process 15619: (SIGCHLD).
Stopped at: handler (hpux_export_stub_norp stub)
(0000C058)
dde> tb
‘main(5): Stopped at: handler (hpux_export_stub_norp stub)
(0000C058)
‘main(4): Called from: _sigreturn (C02033B0)
‘main(3): Called from: \\sigact\main\12
‘main(2): Called from: _start+00a0 (C0140114)
‘main: Called from: $START$+0198 (0000B290)
HP DDE Problem when Debugging Program with
Stack Overflow
When debugging a program with a stack overflow, HP DDE may appear
to hang. In fact, HP DDE has not hung but can take several minutes to
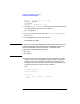
process the overflow. If a stack overflow occurs, the following OS warning
appears on the terminal in which HP DDE was invoked (not the target
program’s I/O window):
Pid <target_pid_number> received a SIGSEGV for stack growth
failure. Possible causes: insufficient memory or swap space, or
stack size exceeded maxssiz.
HP DDE also displays the following message in the transcript window:
Intercepted event type ‘signal SIGSEGV’
These messages appear immediately after the stack overflow. HP DDE
then appears to hang.
The workaround for this problem is to wait. Unfortunately, the wait
could be several minutes. Once HP DDE has processed the event, the
traceback command gives incomplete information. However, you can still
use other commands such as the env command to move up and down the
stack, or print to examine variables.
Another way to determine where the stack overflow occurred is to
interrupt DDE and issue the print `pc -hex command. Then issue the
restart command and the env `va(<pc value>) command will take you
to the instruction where the overflow occurred.