
ktracedump.1m (2010 09)

k
ktracedump(1M) ktracedump(1M)
Another way to do all the steps in the previous example:
# ktracer -R -w ’workload
’>ktrc.out
’workload’ can be replaced by a script name or a command line with or without parameters. If the work-
load has multiple parameters, surround the workload by a pair of single or double quotes per
sh-posix
quoting conventions:
# ktracer -R -w ’find /tmp -name core’ >
ktrace.out
See sh-posix (1) for information about the quotes.
Trace only calls to read and write, capture 30,000 calls per CPU, and produce a trace report that includes
all fields of each trace record:
# ktracer -z -Z -A 30000 -a read -a write -B
# workload
# ktracer -h
# ktracedump -D -A > ktrace.rw
Produce a kernel trace report for a live system (
-D) that includes the traced function list (
-F) and trace
records (absence of
-N). Each trace record shown will consist of the default fields (
H ZSeq CPU PID
TID Function ElUSec SymArg0), plus Caller (
-JCaller), plus AbsSec (-JAbsSec), minus
SymArg0 (
-jSymArg0). The trace records will be sorted by timestamp rather than by CPU number (
-S
AbsSec):
# ktracedump -D -F -JCaller -JAbsSec -j SymArg0 -SAbsSec > rpt.out
If the list of ktracedump command line options grows long, save the options to a file, then have
ktra-
cedump use the options from the file as follows:
# echo ’-A -jPSR -jTPR -jglobal0 -jglobal1 -jglobal2’ > kd.opts
# ktracedump $(<kd.opts) > rpt.out
Usage Scenario
Here is a scenario to demonstrate how ktracer can be utilized to detect and investigate the disappear-
ance of a process.
Imagine a scene where every Friday an engineer starts a process named SETI and expects it to continue
running indefinitely. But when she returns the next Monday, the SETI process is gone, vanished,
nowhere to be found. She wants to know: What happened to it? Did someone kill it? Who? When?
To find the answers, she employs
ktracer so that next time, her SETI process will not disappear
without a trace. Here is a command to set up ktracer:
# ktracer -z -Z -A 30000 -m pm_sig
With the above options, ktracer will clear its previous state (-z -Z), then remember the latest 30000
events (-A 30000), and monitor kernel function calls related to process signals (
-m pm_sig).
# ktracer -D ’-DAF’ -w SETI > whodunnit
Next, the ktracer invocation above executes SETI as the workload, and turns tracing on for the dura-
tion of the SETI run. When SETI terminates, ktracedump will be invoked with the options -DAF,
which means that ktracedump will produce a report from the live system (-D) with all trace fields (-A)
and the traced function list (-F). The ktracedump report will be saved in the file named whodunnit.
The engineer notes the SETI pid is 14235. Now she can leave while ktracer keeps watch.
When she returns, her SETI process is gone. So she looks in the
whodunnit file for traces of PID 14235.
This
whodunnit file contains all available trace fields, which is valuable, but the lines are too long to
display in a man page. So the engineer reruns ktracedump to show only the most noteworthy columns,
limit the Function column to 26 characters max (-J Function%-26.26s), shrink the AbsSec column
width (-J AbsSec%8.3f) and sort the trace records by ascending timestamp (-S AbsSec).
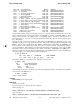
# ktracedump -D -j H -j SpnD -j ElUSec -j PSR \
> -J Function%-26.26s -J AbsSec%8.3f -S AbsSec > who.narrow
When ktracer is not active, ktracedump may be re-run repeatedly using different parameters to for-
mat the same underlying trace data in different ways.
Here is an excerpt from
who.narrow:
HP-UX 11i Version 3: September 2010 − 9 − Hewlett-Packard Company 9