
ktracedump.1m (2010 09)

k
ktracedump(1M) ktracedump(1M)
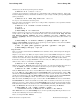
3 ZSeq ON : Zero-based Sequence number
4 Cpu ON : Processor Number
5 PID ON : PID (process ID)
6 TID OFF : TID (thread ID)
7 SpnD ON : Spinlock Depth
8 Caller OFF : Caller function
9 COff OFF : Offset into caller function, in hex
10 Function ON : Traced function (callee)
11 AbsTime OFF : Interval Time Counter (ar44)
12 AbsSec OFF : Absolute Time in Seconds.NanoSec
13 ElTime OFF : Elapsed time since prev trace, in iticks
14 ElUSec ON : Elapsed Time in microseconds.ns
15 StkPtr OFF : Stack pointer
16 PSR ON : PSR pp/ic/pk/dt/i = pCPDI when on, _ off
17 TPR OFF : Task Priority Register (TPR)
18 Nargs OFF : Number of args passed to Function
19 arg0 OFF : Function Argument Value
20 arg1 OFF : Function Argument Value
21 arg2 OFF : Function Argument Value
22 arg3 OFF : Function Argument Value
23 arg4 OFF : Function Argument Value
24 arg5 OFF : Function Argument Value
25 arg6 OFF : Function Argument Value
26 arg7 OFF : Function Argument Value
27 SymArg0 ON : Symbolic Name for Function Argument
28 SymArg1 OFF : Symbolic Name for Function Argument
29 SymArg2 OFF : Symbolic Name for Function Argument
30 SymArg3 OFF : Symbolic Name for Function Argument
31 SymArg4 OFF : Symbolic Name for Function Argument
32 SymArg5 OFF : Symbolic Name for Function Argument
33 SymArg6 OFF : Symbolic Name for Function Argument
34 SymArg7 OFF : Symbolic Name for Function Argument
35 global0 OFF : Your variable
36 global1 OFF : Your variable
37 global2 OFF : Your variable
38 global3 OFF : Your variable
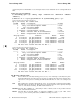
See the Timekeeping section for more information on AbsTime, AbsSec, ElTime and ElUSec.
In the chart above, the "Default(ON/OFF)" column indicates "ON," for the field names H, ZSeq, Cpu,
PID, SpnD, Function, ElUSec, PSR, and SymArg0. Therefore,
ktracedump will show those fields
by default when reporting traces.
ktracedump will hide the field names that are "OFF", namely
SeqNum, TID, Caller, COff, AbsTime, AbsSec, ElTime, SP, TPR, arg0, arg1, arg..., SymArg1,
SymArg2, SymArg..., global0, global1, global2, and global3. These ON/OFF defaults were selected
to make the report width fit on a screen that is 80 characters wide.
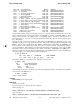
To change
ktracedump behavior from the default, use the -J option to display additional fields.
The TID, Caller, AbsSec, and arg0 through arg3 fields are helpful fields to display.
• Use
-j to hide fields from display.
• Use -j 0 to hide all fields.
• Use -A to display all fields.
-J column [%format]
Request that a specific column be shown when the trace records are displayed. -J requires a
column name or number as an argument. The -J option may be repeated. For example, -J Abs-
Time will cause ktracedump to display the interval timer value for each trace record, in a column
with the column header "AbsTime".
The column can be specified by name or number. For example if
AbsTime is column 11, then -J
11 would have the same results as -J AbsTime.
The
-J option takes an optional format string %format to display in printf format (see printf (1)).
For example,
-J AbsSec%16.9lf would show the AbsSec (Absolute Time in seconds) column as
a 16-character-wide column with 9 places after the decimal, representing seconds.nanoseconds. See
HP-UX 11i Version 3: September 2010 − 3 − Hewlett-Packard Company 3