
ktracedump.1m (2010 09)

k
ktracedump(1M) ktracedump(1M)
restarting ktracer. The following command
# ktracer -A numtraces
will modify how many trace records the kernel collects per CPU.
When the kernel collects more traces,
ktracedump
provides more data to analyze, but takes more time
to generate the report, more disk space to store it, and more effort to search through it.
ktracedump may be invoked repeatedly with different options. The underlying trace data always stays
the same in a dump. On a live system, the underlying trace data stays the same when
ktracer is not
active. However, the trace data may change when
ktracer is active.
HP recommends that you halt
ktracer before running
ktracedump to see trace records on a live sys-
tem. When
ktracedump is invoked while ktracer is active,
ktracedump will display a message
indicating that the results might be inconsistent. Then it will produce a report based on the contents of
each trace at the time that the contents was copied out of the kernel.
You can report the traced function list using
ktracedump -DNF while ktracer is active, because the
traced function list stays constant while
ktracer is active.
To summarize, the trace records may change only while
ktracer is active (on). The traced function list
may change only while
ktracer is inactive (off).
To view
ktracedump output, HP recommends using a text editor that can handle long lines and large
files easily.
Usage Display
When
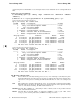
ktracedump is invoked with -? or no arguments, it will display a usage message resembling the
following:
ktracedump Usage: ktracedump [options] > trace_report.out
options:
-D Report trace data from live kernel, /dev/kmem
-A Print all fields of each trace record
-H Show column name, num, desc for all printable fields
-J col%fmt Print column with format.
-j col Turn off printing of this column.
-S col Sort trace records by AbsTime or Seq column
-f col:[iv]:regexp Filter traces where col matches regexp
-N Do not print any trace records.
-F Show the traced function list
Note: In this context, the term "print" means to show or display, not print on paper.
Options
The
ktracedump command line options are described in this section.
-D Read the trace data from the live kernel using /stand/vmunix and /dev/kmem.
The
-D and -m options are mutually exclusive.
-m Read the trace records from a crash dump, using the vmunix and image files in the current direc-
tory. The -D and -m options are mutually exclusive.
In order for trace records to exist in a crash dump,
ktracer must have been activated on the live
system before the crash. See ktracer (1M).
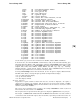
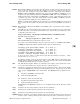
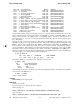
-H List all the fields (columns) that ktracedump is capable of displaying for each trace record. Fields
of the trace record are displayed as columns in the report.
ktracedump -H output is shown below, with field number, name, description, and an indicator of
whether the default behavior of ktracedump is to show or to hide the field from the report.
Columns of printing which can be turned on or off:
N Name Default(ON/OFF) : Description
__ _____ _____________________________
1 H ON : Awk Parse Info
2 SeqNum OFF : Sequence number
2 Hewlett-Packard Company − 2 − HP-UX 11i Version 3: September 2010