
ktracedump.1m (2010 09)

k
ktracedump(1M) ktracedump(1M)
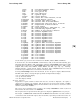
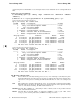
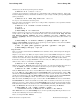
ZSeq Cpu PID Function AbsSec SymArg0
1013 0 1984 pm_signalx 8160.908 0xe00000017ed49300
1014 0 1984 kill 8160.908 0x9fffffff7f7e8d00
1015 0 1984 ksi_dequeue_fl 8160.908 0xe00000017ed49300
1016 0 1984 psignalx 8160.908 0xe00000017ed49300
1017 0 1984 pm_signalx 8160.908 0xe00000017ed49300
1018 1 14235 issig 8160.908 0x2
1019 0 1984 __jobctl_sig_for_psignal 8160.908 0xe00000017ed49300
1020 0 1984 clear_p_sig_jobctl_signa 8160.908 0xe00000017ed49300
1021 0 1984 clear_kt_sig_stopsigs 8160.908 0xe00000017ed49300
1022 0 1984 remove_stops_from_thread 8160.908 0xe00000018ba79480
1023 0 1984 sigvec 8160.908 0x9fffffff7f7e8d00
1024 1 14235 unblock_sigstop 8160.908 0x1
1025 0 1984 setsigvec_remove_ksi_t 8160.908 0xe000000182665280
1026 0 1984 sigvec 8160.908 0x9fffffff7f7e8d00
1027 1 14235 proc_is_killed 8160.908 0xe00000017ed49300
1028 1 14235 ksi_exit 8160.908 0xe00000018ba79b80
Searching through this excerpt for PID 14235, the trace records stop shortly after ZSeq 1027, where PID
14235 called the kernel function named
proc_is_killed()
and then called
ksi_exit(). That
answers what happened to the SETI process -- it was killed. When? 8160.908 seconds after boot, or
8160.908410566 to be exact, based on the more detailed whodunnit file. Now for the more pressing ques-
tion -- Who did it?
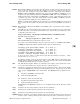
Studying the trace evidence that leads up to 14235
proc_is_killed()
, the PID 1984 on CPU 0 and
PID 14235 on CPU 1 are closely intertwined in time. Look at ZSeq 1014, showing that PID 1984 called
kill(). But can we tell if PID 1984 calling kill() and PID 14235 calling proc_is_killed()
are
truly connected? Look at ZSeq 1015 and the next 2 trace records in sequence. PID 1984 has SymArg0
0xe00000017ed49300. This SymArg0 value from PID 1984 matches the SymArg0 value from the SETI
PID in ZSeq 1027. 0xe00000017ed49300 is the address of the
proc structure of the SETI process.
This trace evidence ties the PID 1984 that called
kill() to the SETI PID 14235 receiving the kill signal
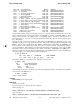
and exiting. What can we discover of the identify of PID 1984?
# ps -p 1984 -f
UID PID PPID C STIME TTY TIME COMMAND
root 1984 1948 0 Nov 15 pts/0 0:00 -ksh
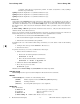
How did this
-ksh get access to the system, and what is it doing now?
# ptree 1984
953 /opt/ssh/sbin/sshd
1948 sshd: user6@pts/0
1984 -ksh
25516 ptree 1984
PID 1984 arrived through secure shell, and is running the
ptree command. The ksh that ran ptree
just now is the same ksh that ran
# kill -9 14235
at 8160 seconds after boot.
AUTHOR
ktracedump was developed by HP.
SEE ALSO
printf(1), ktracer(1M).
Intel IA-64 Architecture Software Developers Manual
Link to Volumes 1-3:
http://www.intel.com/design/itanium/manuals/iiasdmanual.htm
Copy of Volume 2:
http://download.intel.com/design/Itanium/manuals/24531805.pdf
10 Hewlett-Packard Company − 10 − HP-UX 11i Version 3: September 2010