
Tools: Debugging Native and Java Code with WDB

Page 83
Tools for
Debugging
© 2001 Hewlett-Packard Company
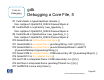
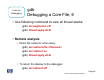
gdb
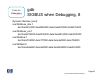
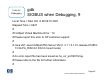
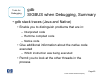
SIGBUS when Debugging, Summary
• gdb stack traces (Java and Native)
• Enable you to distinguish problems that are in:
– Interpreted code
– Runtime compiled code
– Native code
• Give additional information about the native code
executed
– Which instruction was being executed
• Permit you to look at the other threads in the
process