
Migrating Java Applications to HP-UX


9
(Your OE may already come with GlancePlus installed.)
This section provides brief highlights on using glance/gpm to monitor Java applications.
There are 3 ways to run glance or gpm:
• gpm (GUI mode)
• glance screen mode
• glance advisor mode
gpm (GUI mode)
gpm is the graphical version of GlancePlus. It provides extensive information on all aspects of your
system (CPU, memory, disk, and network activity) and detailed information about your processes and
threads in your process.
To run it, set your DISPLAY environment variable, and then invoke gpm as follows:
/opt/perf/bin/gpm
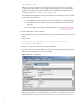
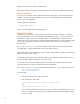
The following figure is an example of the Main panel:
Figure 4 GlancePlus (gpm) main panel
The Main Panel presents an overview of the system with a view of CPU, Network, I/O, and Memory.
The Reports menu lets you select more detailed information, both global to the system, and process-
specific.
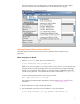
To examine an individual process, select:
Reports—>Process list (select the process you want to monitor)
From the process screen, select more details (for example, system calls, memory regions, thread list...)