
Migrating Java Applications to HP-UX


8
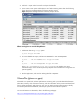
4. Click File—>Open File to browse for and open the data file.
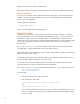
5. A GC viewer screen opens and displays a set of tabs containing metric data. The following
figure shows the Garbage Collection Summary Analysis screen:
Figure 3 HPjmeter Garbage Collection Summary Analysis Screen
When running Java on non-HP-UX platforms:
1. Collect GC data using -Xloggc option.
$ java -Xloggc:filename ...
2. For more detailed GC output, add -XX:+PrintGCDetails or -XX:+PrintHeapAtGC
$ java ... -XX:+PrintGCDetails -Xloggc:filename
or
$ java ... -XX:+PrintHeapAtGC -Xloggc:filename
(Using -XX:+PrintGCDetails and -XX:+PrintHeapAtGC together can cause
intermixed output, which cannot be parsed by HPjmeter. We recommend not using these two
options together.)
3. Run the application, and view the resulting data file in HPjmeter.
GlancePlus (glance or gpm)
GlancePlus is a system-level, real-time performance monitoring tool. It provides detailed information
about CPU, memory, disk, and network activity, and also information at the process and thread level
from a system perspective. With glance or gpm, you can easily examine system activities, identify
and resolve performance bottlenecks, and tune your system for more efficient operation.
For more information on GlancePlus, refer to the following webpage:
http://www.managementsoftware.hp.com/products/gplus/index.html