
Migrating Java Applications to HP-UX


6
java<pid>_<t>.eprof
NOTE: If you are running JDK 1.5.0.04 or later, the command-line option is not required
to capture eprof data. Instead, you can toggle eprof data gathering on and off by sending
signals to the currently running Java VM. One log file is produced per sample period; the
name for the log file is java<pid>_<startTime>.eprof.
The SIGUSR2 signal toggles the recording of eprof data. Use the following process to gather
eprof data for specific periods:
• Send SIGUSR2 to the Java VM process. The Java VM begins recording eprof data.
• Send SIGUSR2 to the Java VM process. The Java VM flushes eprof data and closes
the log file.
For more information, see Profiling with Zero Preparation in the HPjmeter User's Guide.
2. Run the application to create a data file.
3. Start the HPjmeter console from a local installation on your client machine. For example, here
are two
different ways:
$ $JAVA_HOME/bin/java <heap_settings> -jar /opt/hpjmeter/lib/HPjmeter.jar
$ /opt/hpjmeter/bin/hpjmeter
4. Click File—>Open File to browse for and open the data file.
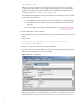
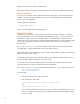
5. A profile analysis screen opens, displaying a set of tabs containing summary and graphical
metric data. The following screen shows an example:
Figure 1 HPjmeter — Profile Data
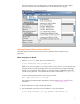
Click among the tabs to view available metrics. Use the Metrics or Estimate menus to select
additional metrics to view. Each metric you select opens in a new tab. Hover your mouse