
Migrating Java Applications to HP-UX


5
o Graphic display of profiling data
o Threads histogram and lock contention metrics
o CPU/clock time metrics for Java methods
o Call graphs with call count, CPU, or clock time
o Per-thread display of time spent in nine different states
o Per-thread or per-process display of metrics
o Reference trees for heap analysis
• In-depth garbage collection analysis:
o Graphical display of Java heap usage and garbage collector behavior over time
o Details of GC type, GC frequency, GC duration, object creation rate, cumulative
memory allocation
o User-configurable graphs for presenting all heap and GC data
o Detailed summaries of GC activity and system resource allocation, along with other
system and JVM runtime and version data
This document describes using some of HPjmeter's static data analysis features to analyze the
performance of your migrated Java application.
For more details, as well as information on HPjmeter's Real-Time capabilities, refer to the Java
Troubleshooting Guide for HP-UX Systems, and the HPjmeter User's Guide.
The steps for collecting the profiling and garbage collection data for static data analysis are
described below.
See the section “Key Factors Affecting Performance” for steps on viewing the data in HPjmeter to
identify common Java performance problems.
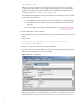
Collecting Profile Data for HPjmeter
The following steps summarize how to collect and view profiling data from your application.
For applications running on HP-UX, use the extended profiling option -Xeprof to capture
profile data, and then view the data in HPjmeter. For applications running on non-HP-UX
platforms, you can use the -Xrunhprof or -agentlib:hprof options, and use HPjmeter to view
the data. The examples in this section use the -Xeprof option.
1. Change the command line of your Java application to use -Xeprof.
To collect Xeprof data during the entire execution of the launched Java application, use:
$ java -Xeprof <yourApp>
You can send the Xeprof output to a specified file using the file= keyword as follows:
$ java -Xeprof:file=<yourApp>.eprof <yourApp>
The <pid> will be inserted automatically in the file name, for example,
<yourApp><pid>.eprof.
To collect Xeprof data for a specified time interval, there are two options:
a. Turn on/off profiling based on specified time since program start:
$ java -Xeprof:time_on=<start_time>,time_slice=<length_of_collection_time> <yourApp>
b. Turn on/off profiling using signals (for example, sigusr1 and sigusr2):
$ java -Xeprof:time_on=sigusr1,time_slice=sigusr2 <yourApp>
The generated filename will include the time between the start of an application and the start
of profiling. For example: