
Migrating Java Applications to HP-UX

37
(-Xmx, -Xms) (see discussion on defaults in the “Key Factors Affecting Performance” section.)
• Permanent space (mmap region)
(-XX:PermSize, -XX:MaxPermSize) (defaults: 16m, 64m)
• Code Cache (mmap region) - contains runtime compiled code
(-XX:ReservedCodeCacheSize) (IA default: 64m, PA default: 32m)
• C heap (data region) - contains JVM C/C++ data structures
• Java application thread stacks (mmap region) [multiply by number of threads]
(-Xss) (IA default: 512k**, PA default: 512k)
** see clarification in the “Threads in the Java Process” section below.
• main stack (stack region)
• text (text region)
• shared libraries
• internal JVM thread stacks (mmap region)
see “Threads in the Java Process” section below
Tools to Examine Java Process Memory Footprint
To look at the memory usage of your Java process and what is contributing to the footprint, use
Xverbosegc data and glance adviser script data to give you a high-level view.
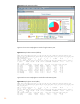
The following is an example from glance adviser output:
PH: proc_name pid cpu cpu_sys cpu_usr vss rss data_vss data_rss threads files io disk_io
P: java 28818 353.78 29.58 324.20 3534380kb 3403056kb 77660 77660 89 173 0.00 0.00
Columns 6 and 7 show VSS (3.5GB) and RSS (3.4GB) of the entire process.
Columns 8 and 9 show VSS (77MB) and RSS (77MB) of the data segment (C heap).
From this data, you can observe the memory usage over time and whether the process stabilizes.
You can also see how much of the memory usage is due to C heap (JVM structures) versus Java heap
and other memory-mapped regions.
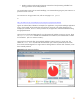
To look at the memory regions in more detail, use gpm:
1. Start up gpm
2. Select Reports->Process List (brings up process screen)
3. Select java process from process screen
4. From process screen, select Reports->Memory Regions
5. Sort Memory Regions by VSS (Select Configure->Sort Fields)
click on VSS, click on left most column header, click "done"