
Migrating Java Applications to HP-UX


36
configuration files may require updating - if a config file points to an old IP address or
missing file, an exception will occur. Excessive exceptions can also be caused by non-
optimal programming, where exceptions are used for control logic.
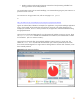
You can use HPjmeter to see the number of exceptions and where they are occurring:
1. Collect Xeprof profile data.
2. Open file in HPjmeter (File->Open File)
3. Select Estimate->Exceptions Thrown
This pops up a box with "Exceptions Thrown" showing the number of exceptions and
in what methods they occur.
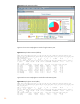
4. Click on the <method name>, and click button "Mark to Find"
5. Bring up Call Graph Tree:
Select Metrics->Code/CPU->Call Graph Tree (Call Count)
6. Find Method in Call Graph Tree:
Select Edit->Find Immediately
7. Expand method (click +) to see type of exception being thrown.
If these exceptions are the result of an unexpected deployment error, then you can fix the
error. If it is not possible to remove the source of the exception, then use the following option
to suppress the filling in of the stack trace by the JVM when an exception occurs, thereby
reducing some of the performance hit from exception handling:
-XX:-StackTraceInThrowable
System Components
There are other system components that could be causing bottlenecks in overall system performance,
thereby hiding application server performance. These include the database, network, and file system.
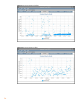
You can use HPjmeter and glance as an indicator of whether these components are affecting
performance. Then, use other tools to monitor the database, network, and file system, and tune them
if necessary.
Memory Footprint of Migrated Java Application
When migrating your Java application to HP-UX, there will be some differences in the size or footprint
of the Java process due to different memory layout and different JVM defaults. In general, we expect
the size of the Java process on HP-UX to be comparable to other platforms. You might observe small
differences in the size at the initial startup of your application. But, the growth in size over time and
the steady-state footprint should be similar to your previous platform. For a long running server
application, with a large Java heap, the small differences at startup will be insignificant compared to
total size after the application reaches steady-state. Therefore, we recommend that you do not get
overly concerned with small differences in starting footprint.
Java Process Memory Footprint
The Java process memory footprint is made up of the following:
(Note: the defaults listed apply to 32-bit processes)
• Java heap (mmap region)