
Migrating Java Applications to HP-UX

26
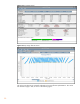
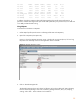
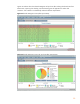
Figure 18 shows this application has an huge amount of lock contention, with every thread
showing a large amount of red:
Figure 18 Threads Histogram screen
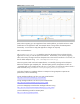
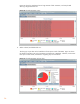
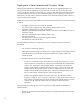
4. Select a thread, and double-click on it.
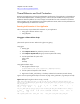
This brings up a pie chart with a breakdown of time spent in each of the states. Figure 19 shows
this thread is spending 72% in lock contention and 24% time in Garbage collection, and no CPU
time spent. In other words, the thread is not getting any real work done:
Figure 19 Threads Histogram with pie chart