
Migrating Java Applications to HP-UX

25
PS: read 284859 835228 28485.9 20880.7 106.44 316.07
PS: write 34113 100071 3411.3 2501.7 0.09 0.26
PS: ioctl 11630 34002 1163.0 850.0 9.23 27.54
PS: poll 11373 33363 1137.3 834.0 20.01 60.05
PS: send 147110 430968 14711.0 10774.2 1.62 4.79
PS: sched_yield 854681 2006240 85468.1 50156.0 1.41 2.41
PS: ksleep 16701 47976 1670.1 1199.4 224.94 826.68
PS: kwakeup 16636 47767 1663.6 1194.1 0.03 0.10
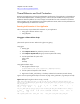
In addition, the glance output provides useful data regarding the overall system performance. In
particular, note the CPU usage 353% (user 324% and system 29%), the process size (vss 3.5GB and
rss 3.4GB), and 89 threads running.
Using HPjmeter
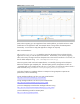
To examine lock contention in HPjmeter:
1. Collect Xeprof profile (see the section “Collecting Profile Data with HPjmeter”).
2. Open file in HPjmeter (File->Open File)
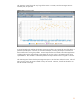
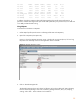
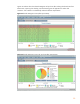
Figure 17 shows the HPjmeter Summary screen, including the running time (that is, for how long
the profile was collected), and shows the application has 313 threads:
Figure 17 HPjmeter Summary screen
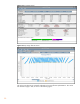
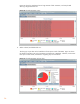
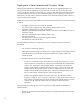
3. Click on Threads Histogram tab
The threads histogram shows each thread, its lifetime, and a color-coded set of states indicating
how the thread is spending its time: lock contention, garbage collection, CPU, I/O, sleeping,
waiting, and so forth. "Red" indicates "lock contention"