
Migrating Java Applications to HP-UX

24
HPjmeter 4.0 User's Guide
http://www.hp.com/go/hpux-java-docs
Thread Behavior and Lock Contention
Because Java applications are heavily multi-threaded, performance of the application is dependent on
the OS thread implementation, scheduling policies, and how the JVM handles the acquiring of locks.
Differences between platforms can cause changes in thread behavior and increased lock contention.
When migrating your Java application from another platform to HP-UX, make sure that performance is
not being affected by increased lock contention.
Detecting Lock Contention in Your Application
There are two easy ways to detect lock contention in your application:
• Using gpm or Glance Advisor script
• Using HPjmeter
Using gpm or Glance Advisor Script
(Also see the previous section “Glance Plus (glance or gpm)”)
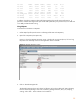
Using gpm:
1. Startup gpm.
2. Select Reports->Process list (select the process to monitor)
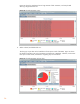
3. Select Reports->System Calls (brings up Process System Calls screen)
4. Look at SysCall Rate for system calls:
sched_yield
ksleep
kwakeup
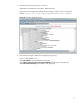
Using glance advisor script:
1. Start up glance adviser script:
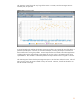
javaGlanceAdviser.ksh <pid> [output-file] [sampling-interval]
2. Look at system call output for each interval.
3. High rates of sched_yield, ksleep, or kwakeup indicate lock contention (see 3rd column).
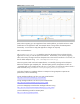
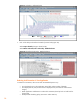
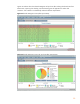
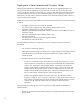
Figure 16 shows partial glance output with some very high sched_yield rates (e.g, 85K per second):
Figure 16 Output from glance advisor script (1 record)
GBLH: date time swap nfile cpu_tot cpu_sys cpu_usr run_q mem_virt mem_res pageout_rate
pageout_rate_cum bufcache_hit_pct disk_io net_in_pkt_rate net_in_err_rate net_out_pkt_rate
net_out_err_rate
GBL: 05/28/2010 13:33:10 16 1 51 5 46 1 7995mb 21.46 0 0
100.00 1.80 12612 0 13959 0
PH: proc_name pid cpu cpu_sys cpu_usr vss rss data_vss data_rss threads files io disk_io
P: java 28818 353.78 29.58 324.20 3534380kb 3403056kb 77660 77660 89
173 0.00 0.00
PSH: syscall_name count count_cum rate rate_cum total_time total_time_cum