
Migrating Java Applications to HP-UX


10
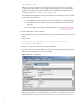
Detailed on-line help is provided on the Main Panel.
Additional examples of using gpm are provided in the section “Key Factors Affecting Performance.”
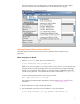
Glance Screen Mode
If you only have a terminal window available and cannot invoke gpm, a screen mode of glance is
available. But this can be fairly cumbersome to use, and the command letters are not particularly
intuitive. gpm is far preferable.
To invoke glance in screen mode:
/opt/perf/bin/glance
To see a list of available commands (letters), type "?"
Glance Adviser Mode
Sometimes it is not practical to watch and do live monitoring of a system with gpm. For example,
when the application runs for a long time before the problem point occurs, it is more convenient to
collect data in "batch" mode to be viewed later. Also, it is often desirable to save performance
metrics from a run for future reference. The glance adviser mode allows you to collect the glance data
into a file to analyze later. We have found this facility extremely useful for remote analysis of
customer issues.
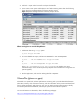
The javaGlanceAdviser.ksh script is provided to collect metrics that are commonly useful for
Java applications. It collects global metrics and process-specific metrics.
Examples of global metrics collected: OS version, machine name, number of CPUs, physical memory,
buffer cache sizes, number of disks.
Examples of process-specific metrics collected: name, pid, cpu utilization (system and user), vss, rss,
number of threads, number of open files, io rate, disk io rate
For each process, the script also collects metrics for the system calls made by the process: name,
count, cumulative count, call rate, cumulative call rate, and total time
The javaGlanceAdviser.ksh script is shipped with HPjmeter 4.1. You can obtain a copy from:
http://www.hp.com/go/hpjmeter
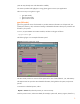
To invoke script:
1. Start up your Java process. Get its process id.
2. Start up glance to collect data:
javaGlanceAdviser.ksh <pid> [output-file] [sampling-interval]
e.g.
javaGlanceAdviser.ksh 1613 ga.out.1613 5
This will collect data every 5 seconds for process 1613 and write output to file ga.out.1613.
If the run is going to be really long, you can change this interval to be less frequent, maybe
every 20 seconds.