
Java Troubleshooting Guide for HP-UX Systems
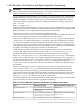
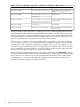
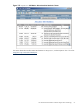

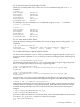

Table 1-17 Actions, JVM Options Specified, and Allocation Site Statistics Data Locations (continued)
Allocation Site Statistics Data LocationsJVM Options SpecifiedAction
JVM creates a file for you, file name
format is: java_<pid>.vgc
-XX:+PrintAllocStatistics'kill 21 <pid>'
Standard out
-XX:+PrintAllocStatistics'kill 21 <pid>'
-Xverbosegc
Same location as Xverbosegc data file
(mydata.vgc)
-XX:+PrintAllocStatistics'kill 21 <pid>'
-Xverbosegc:file=mydata.vgc
Standard out
-Xverbosegc'kill 21 <pid>'
Same location as Xverbosegc data file
(mydata.vgc)
-Xverbosegc:file=mydata.vgc'kill 21 <pid>'
Sending multiple SIGPROF signals to a running Java process produces multiple allocation site
statistics dumps and the JVM dumps the buffered data immediately after the SIGPROF is received.
Allocation site statistics counters inside the JVM are reset after each SIGPROF induced the dump
of the data. HPjmeter consolidates data from multiple allocation site statistics dumps into one
report that is presented in a new tab in the Xverbosegc data visualizer.
Allocation sites can originate from interpreted as well as compiled Java code when specifying
-XX:+PrintAllocStatistics, and only allocations coming from compiled code are reported.
The JVM detects and compiles the application’s (and JDK's) most active Java methods as early
as possible. Though reporting allocation sites originating from compiled code is only incomplete
from a comprehensive reporting point of view, it does always report the most active allocation
sites (the sites most likely to cause GC performance problems).
In the following example, the default sort on the table is determined by % Allocated, meaning
the percent of memory allocated to the objects generated by the compiled portion of the running
Java application. The values in this column are displayed in descending order, from greatest
area of memory use to the least. Making code changes first in the area where memory use is
greatest can have more significant impact on the heap.
52 Diagnostic and Monitoring Tools and Options