
Java Troubleshooting Guide for HP-UX Systems


1.30 Allocation Site Statistics and Zero Preparation Xverbosegc
IMPORTANT: The information in this section is supported on only JDK 5.0.14 (or later) and JDK
6.0.02 (or later) releases. Additionally, to properly view zero preparation Xverbosegc and allocation
statistics information, you must use HPjmeter 3.1 (or later).
For Java applications started without -Xverbosegc, you can prompt the Java Virtual Machine
(JVM) to emit HP Xverbosegc information by sending the running Java program a SIGPROF
signal. For example, assume the running Java process ID is 6754. Executing either of the two
actions listed below prompts the JVM to start emitting detailed HP Xverbosegc information:
kill -21 6754
kill -s sigprof 6754
Issuing a second SIGPROF signal to the running Java program prompts the JVM to stop emitting
the Xverbosegc information. Similarly, issuing yet another SIGPROF signal to the running process
prompts the JVM to start issuing Xverbosegc information one more time.
Additionally, and only if you had started the Java application with
-XX:+PrintAllocStatistics, when zero preparation Xverbosegc is enabled as specified in
the previous paragraph, the JVM also emits detailed allocation site statistics.
If you start your application with -XX:+PrintAllocStatistics, and if you do not specify
-Xverbosegc, or send the running process a SIGPROF signal, then the JVM emits allocation
site statistics to standard out when the application terminates. (That is, when the Java process
stops running.) If you do not want to wait for the application to terminate, or if the application
is designed to be long running (or does not terminate), then you can obtain allocation site statistics
by sending the running Java program a SIGPROF as described above.
Unlike Xverbosegc information emission in zero preparation mode, which is started with a
SIGPROF and stopped with a second SIGPROF, when -XX:+PrintAllocStatistics is
specified, allocation site statistics are emitted every time the JVM receives a SIGPROF.
When -XX:+PrintAllocStatistics is specified along with -Xverbosegc, allocation site
statistics data are directed to the same output specified for HP Xverbosegc. If no output file is
specified, allocation site statistics are directed to standard out (to the terminal where the program
was started from). When -XX:+PrintAllocStatistics is specified alone (without
-Xverbosegc on the command line), allocation site statistics are directed to standard out (to
the terminal).
When a SIGPROF signal is sent to a running Java process that was originally started with
-XX:+PrintAllocStatistics on the command line, the SIGPROF signal also enables
Xverbosegc data collection if Xverbosegc was not specified on the command line when the
program was started. The output of both Xverbosegc and allocation site statistics is directed to
a file created for you by the JVM. The name of the file created by the JVM has the following
format: java_<pid>.vgc. Where <pid> is the Java process ID.
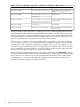
The following table lists all possible permutations and corresponding locations of emitted data
for both allocation site statistics and zero preparation Xverbosegc.
Table 1-17 Actions, JVM Options Specified, and Allocation Site Statistics Data Locations
Allocation Site Statistics Data LocationsJVM Options SpecifiedAction
Standard out
-XX:+PrintAllocStatistics
No special action taken
-Xverbosegc
Same location as Xverbosegc data file
(mydata.vgc)
-XX:+PrintAllocStatistics
No special action taken
-Xverbosegc:file=mydata.vgc
Standard out
-XX:+PrintAllocStatistics
No special action taken
1.30 Allocation Site Statistics and Zero Preparation Xverbosegc 51