
Java Troubleshooting Guide for HP-UX Systems


heap dump format generated by the -XX:+HeapDumpOnOutOfMemoryError option is the
hprof binary format.
One known issue exists: the-XX:+HeapDumpOnOutOfMemoryError option does not work with
the low-pause collector (option -XX:+UseConcMarkSweepGC).
1.26.4 -XX:+HeapDumpOnly
Starting with SDK 1.4.2.11 and JDK 1.5.0.05, the -XX:+HeapDumpOnly option or the
_JAVA_HEAPDUMP_ONLY environment variable can be used to enable heap dumps using the
SIGVTALRM signal (signal 20). This interface is provided to separate the generation of thread
and trace information triggered via SIGQUIT from the heap dump information. If
the-XX:+HeapDumpOnly option is specified or the _JAVA_HEAPDUMP_ONLY environment
variable is set, then the heap dump functionality is triggered by sending SIGVTALRM to the
process. The printing of thread and trace information to stdout is suppressed.
The heap dump is written to a file with the following filename format:
java_<pid>_<date>_<time>_heapDump.hprof.txt.
The default output format is ASCII. The output format can be changed to hprof binary format
by setting the _JAVA_BINARY_HEAPDUMP environment variable. This environment variable can
also be used with the -XX:+HeapDump option to generate hprof binary format with the SIGQUIT
signal.
1.26.5 Using Heap Dumps to Monitor Memory Usage
By creating a series of heap dump snapshots, you can see how the number and size of objects
varies over time. It is a good idea to collect at least three snapshots. The first one serves as a
baseline. It should be taken after the application has finished initializing and has been running
for a short time. The second snapshot should be taken after the residual heap size has grown
significantly. Monitor this using -Xverbosegc and HPjmeter. Try to take the last snapshot
just before the heap has grown to a point where it causes problems resulting in the application
spending the majority of its time doing full GCs. If you take other snapshots, spread them out
evenly based on residual heap size throughout the running of the application. The leak is easier
to track down if the difference in size between heap dumps is large.
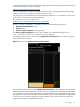
After you have collected the snapshots, read them into HPjmeter (run with -Xverbosegc to
monitor memory usage). When creating heap dumps, running the application with smaller heap
sizes will result in smaller heap dump files. Smaller heap dump files enable HPjmeter analysis
to use less memory. Read two files in and compare them using the File->Compare option. You
should be able to find out the types of objects that are accumulating in the Java heap. Select a
type using the Mark to Find option and go back to a view of one of the snapshots. Go to the
Metric->Call Graph Tree option and do a Find. You should be able to see the context of
the object retention.
1.27 -XX:ErrorFile
The JDK 6.0 release contains a new option, -XX:ErrorFile=<errfilename>. This option can
be used to replace the default filename (hs_err_pid<pid>.log) for the fatal error log.
If this option is used with the JAVA_CORE_DESTINATION environment variable, errfilename
can specify an absolute path, a relative path, or a filename placed in the
JAVA_CORE_DESTINATION directory. The following list explains how the combination of the
errfilename with the JAVA_CORE_DESTINATION environment variable can be used to do
this:
1.27 -XX:ErrorFile 49